The Grammar of Graphics Assembles

R, Python, SQL… and Now TYPST

2026-06-30

Issue 01Origin Story

Every hero starts with a problem nobody else will fix.

The Dark Past

  • Different fonts between prose and figure.
  • Different colour palettes: slide theme vs. plot theme.
  • Two render passes, document and figure compiled separately.
  • No shared layout, so figure margins are guesswork.

Gribouille

#figure(
  plot(data: penguins, ...),
  caption: [Figure 1.],
)

R / Python + import

ggplot(penguins) + ...
ggsave("fig.svg")
#image("fig.svg")

The scars every figure carried, workflow after workflow.

The Spark

Before the powers, the ordinary day job.

With Typst Render I can render any Typst content straight into Quarto.

But, why do I still need to use R or Python to draw a plot?

What if one engine compiled the figure and the prose?

The Spark

  • I wanted a plot from a CSV: no kernel, no session, no heavy dependencies.
  • Typst was already compiling diagrams for me. Why not the plot too?

A grammar of graphics… inside a database?

Why not inside a document compiler.

Last year, ggsql brought the grammar into SQL.

Gribouille was born of necessity, not ambition.

Issue 02The Graphing API

Wilkinson’s grammar, native to Typst.

data + aes()

#import "@preview/gribouille:0.4.1": *
#plot(
  data: penguins,
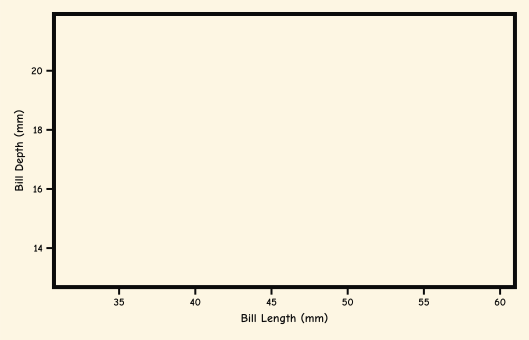
  mapping: aes(x: "bill-len", y: "bill-dep"),
  layers: (geom-blank(),),
  labels: labels(x: "Bill Length (mm)", y: "Bill Depth (mm)"),
  theme: theme-comic(),
  width: auto,
  height: auto,
)

Empty plot frame with bill length on the x-axis and bill depth on the y-axis — the coordinate system is established before any layer is added.

One line to import. No R session, no Python environment.
It is a Typst Universe package.

+ geom-point()
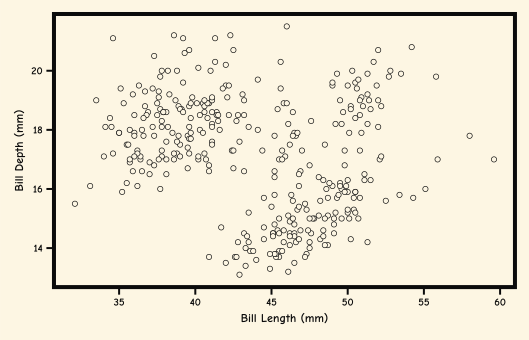
layers: (geom-point(size: 2pt),),

Scatter plot of bill length vs bill depth for 344 penguins, all marks in a single ink colour on a cream panel with a bold border.

+ aes(fill = “species”)

mapping: aes(x: "bill-len", y: "bill-dep", fill: "species"),
scales: (scale-fill-discrete(palette: comic-colours),),

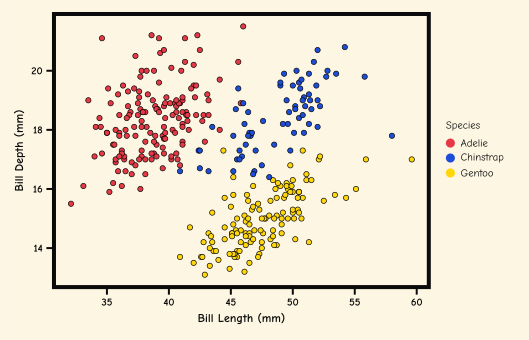
Scatter plot of bill length vs bill depth coloured by species: Adelie in red, Chinstrap in blue, Gentoo in yellow, with a legend.

+ facet-wrap(“species”)

facet: facet-wrap("species"),

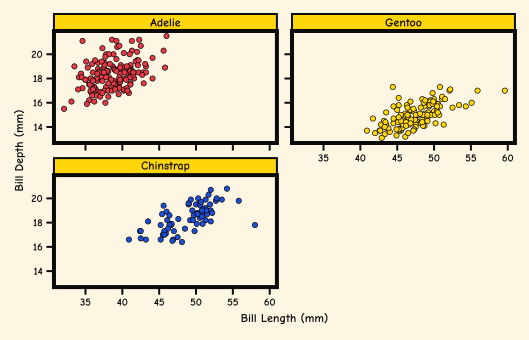
Scatter plot faceted by species into three panels — Adelie, Chinstrap, Gentoo — each framed with a bold border and a yellow strip header.

compose()

compose(
  defer(plot, ...)),
  defer(plot, ...)),
  columns: 2,
  labels: labels(title: comic-title("Palmer Penguins: Morphometrics")),
  collect: ("fill",),
)

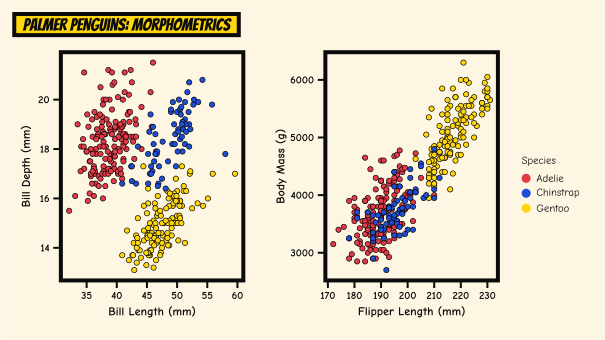
Two-panel composition: bill length vs bill depth on the left, flipper length vs body mass on the right, with a shared species colour legend.

Typst has no lazy evaluation, so defer() captures the plot spec without rendering it yet.

annotate(“typst”, …)
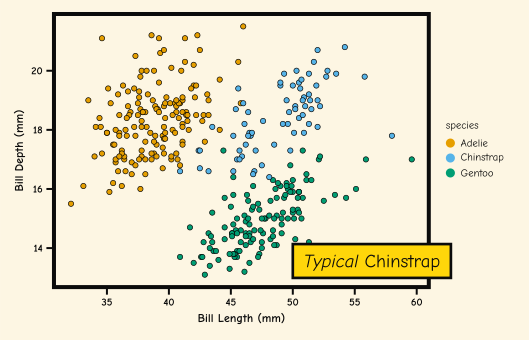
annotate(
  "typst", ...,
  label: [#box(inset: 8pt, fill: rgb("#ffd60a"), stroke: 2pt + rgb("#0b0b0b"))[_Typical_ Chinstrap]],
  anchor: "west",
  size: 14pt,
  clip: false
),

Scatter plot with a vertical red reference line at bill length 45 mm and an italic Typst annotation 'typical Chinstrap' placed near the cluster.

Pure Typst content — no new API needed.

Issue 03Faithful, and Not

Same grammar, different runtime.

Adherence vs. Departure

Faithful to ggplot2

  • aes() mapping.
  • Layered geom* / stat*.
  • scale*, facet*, coord*.
  • guides(), theme*.
  • Layers stack in draw order.

Departs by necessity

  • kebab-case: geom-point, stat-identity.
  • No + operator: one plot() call with named args (layers, scales, facet).
  • Marker body is fill, outline is colour.
  • labels() not labs(); avoid abbreviations.
ish

The vocabulary is stable. The question was never “what should the API look like?” It was “how do I wire it to Typst?”

The Pipeline

The departures are not arbitrary. They reflect how Typst works.

  • Typst has no objects. Every construct — plot(), aes(), geom-*, scale-* — builds a spec dict.
  • render.typ walks a fixed pipeline:

Pipeline diagram: eight yellow boxes labelled data, stat, position, scale, coord, facet, theme, render, connected left-to-right by arrows.

Each stage receives dicts, transforms them, passes dicts forward. The final stage emits a CeTZ canvas.

Payoff: One Engine

The figure stops being a tourist.

The integration an SVG import can never close

Figure and prose are compiled by the same engine, in one pass. Switch the document theme and the figures follow. Annotate, caption, and cross-reference the plot like any other element.

Same Engine!

Typst

Issue 04Built With AI, 2026

Porting a grammar with agentic tools.

Timeline

Manual first. AI later, once it was safe to.

Plan, then hand-build

  • Grammar and theme API design.
  • cetz as the drawing layer.
  • Core written and reviewed by hand.
  • Tests, snapshots, docs, until the architecture was safe to automate on.

Then accelerate

  • LLMs with proper guardrails.
  • Heavy Human review.
  • v0.1.0: May 20.
  • v0.2.0: June 1.
  • v0.3.0: June 14.
  • v0.4.0: June 22.
  • v0.4.1: June 23 (current).

Really!
v0.4.1

Earn the Right to Automate

1. Hand-build

Core grammar coded, edited, and reviewed manually. No AI on an unstable foundation.

2. Harden

Tests, snapshots, documentation: the guardrails that make change safe.

3. Accelerate

Only then bring in LLMs, to speed up well-bounded work.

What carried, what didn’t

Stable vocabulary ported cleanly, a good LLM target.
AI stumbled on Typst’s no-lazy-eval model, cetz primitives, and scale/stat edge cases.
Human review caught it.

manual
guardrails

Issue 05Where It Stands

v0.4.1

Rising Out of the Shadows

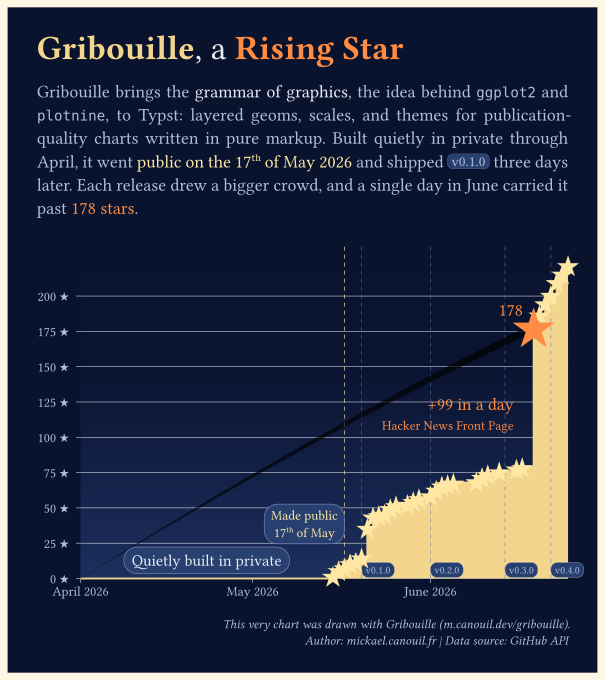
Midnight-sky line chart of Gribouille's cumulative GitHub stars per day from April to June 2026, titled 'Gribouille, a Rising Star'. A luminous gold step trail rises from zero across a long flat run labelled 'Quietly built in private', lifts at a gold dashed marker labelled 'Made public 17th of May', then climbs through dashed release markers to a final amber spike annotated with a one-day jump.

What Ships, What Doesn’t

  • Geoms: point, line, bar, col, area, boxplot, ribbon, histogram, contour, hex, tile, text, smooth, rug …
  • Scales: continuous, discrete, manual; brewer, viridis, okabe-ito, gradient; size, alpha, shape …
  • Themes: grey, minimal, classic, bw, void, linedraw, light, dark.

Not there (yet)

  • Static output only.
  • Performance at scale not benchmarked.
  • Not all geoms/stats ported: maps and complex stat pipelines (WASM possible).

Where to Help

Feedback is welcome:

  • Bug reports: the test suite is young, edge cases are still being found as I use Gribouille, e.g., m.canouil.dev/tidytuesday
  • Documentation examples: a lot of dummy examples, but a few “real” examples.

Gribouille is an unfunded spare-time project, and parts of the API are still settling.
Pull requests are not being accepted for now.