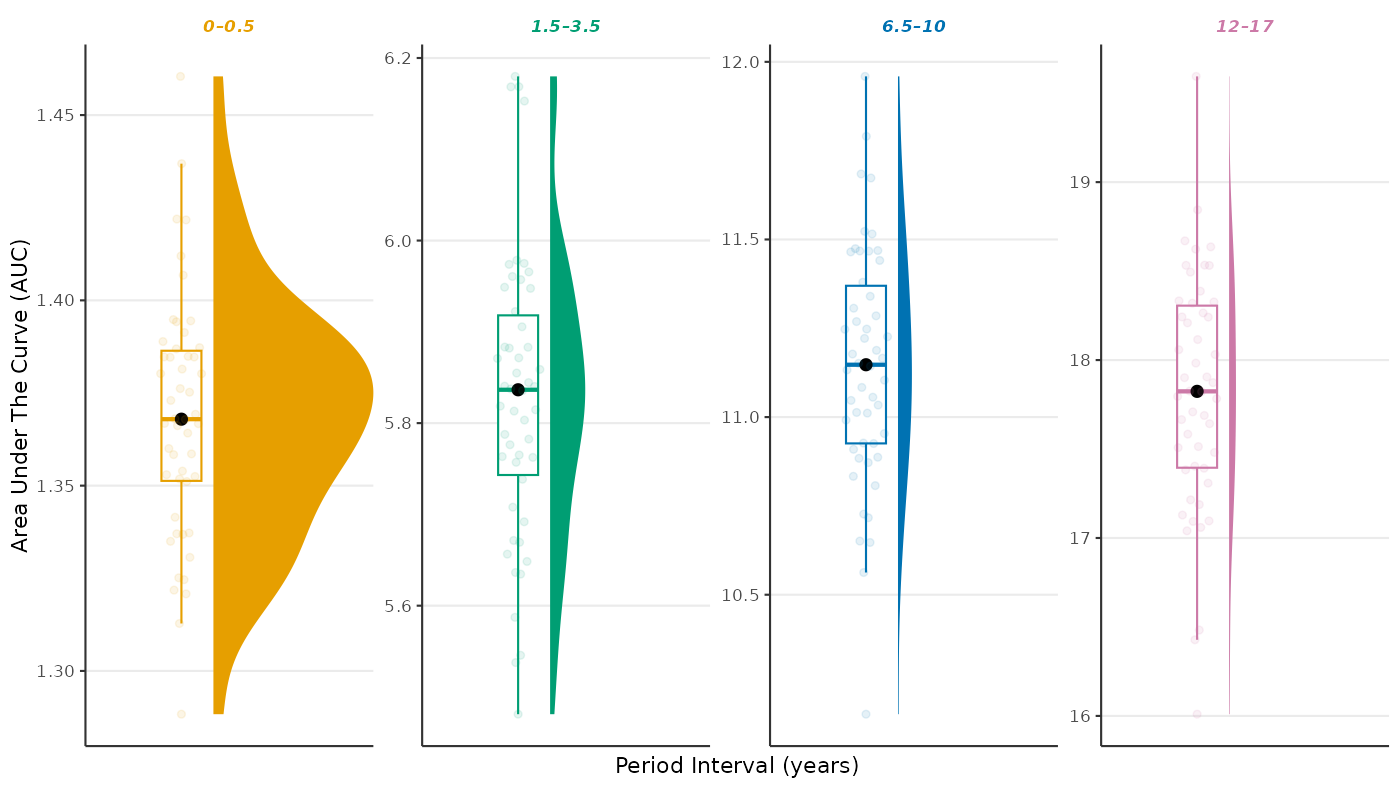
Plot derived area under the curves from a model fitted by time_model().
Source: R/plot_aucs.R
plot_aucs.RdPlot derived area under the curves from a model fitted by time_model().
Arguments
- fit
A model object from a statistical model such as from a call to
time_model().- method
The type of model provided in
fit, i.e., one of"cubic_slope","linear_splines"or"cubic_splines".- period
The intervals knots on which AUCs are to be computed.
- knots
The knots as defined
fitand according tomethod.
Examples
library(ggplot2)
library(eggla)
data("bmigrowth")
ls_mod <- time_model(
  x = "age",
  y = "log(bmi)",
  cov = NULL,
  data = bmigrowth[bmigrowth[["sex"]] == 0, ],
  method = "linear_splines"
)
#> nlme::lme(
#>   fixed = log(bmi) ~ gsp(age, knots = c(0.75, 5.5, 11), degree = rep(1, 4), smooth = rep(0, 3)),
#>   data = data,
#>   random = ~ gsp(age, knots = c(0.75, 5.5, 11), degree = rep(1, 4), smooth = rep(0, 3)) | ID,
#>   na.action = stats::na.omit,
#>   method = "ML",
#>   control = nlme::lmeControl(opt = "optim", maxIter = 500, msMaxIter = 500)
#> )
plot_aucs(
  fit = ls_mod,
  method = "linear_splines"
)