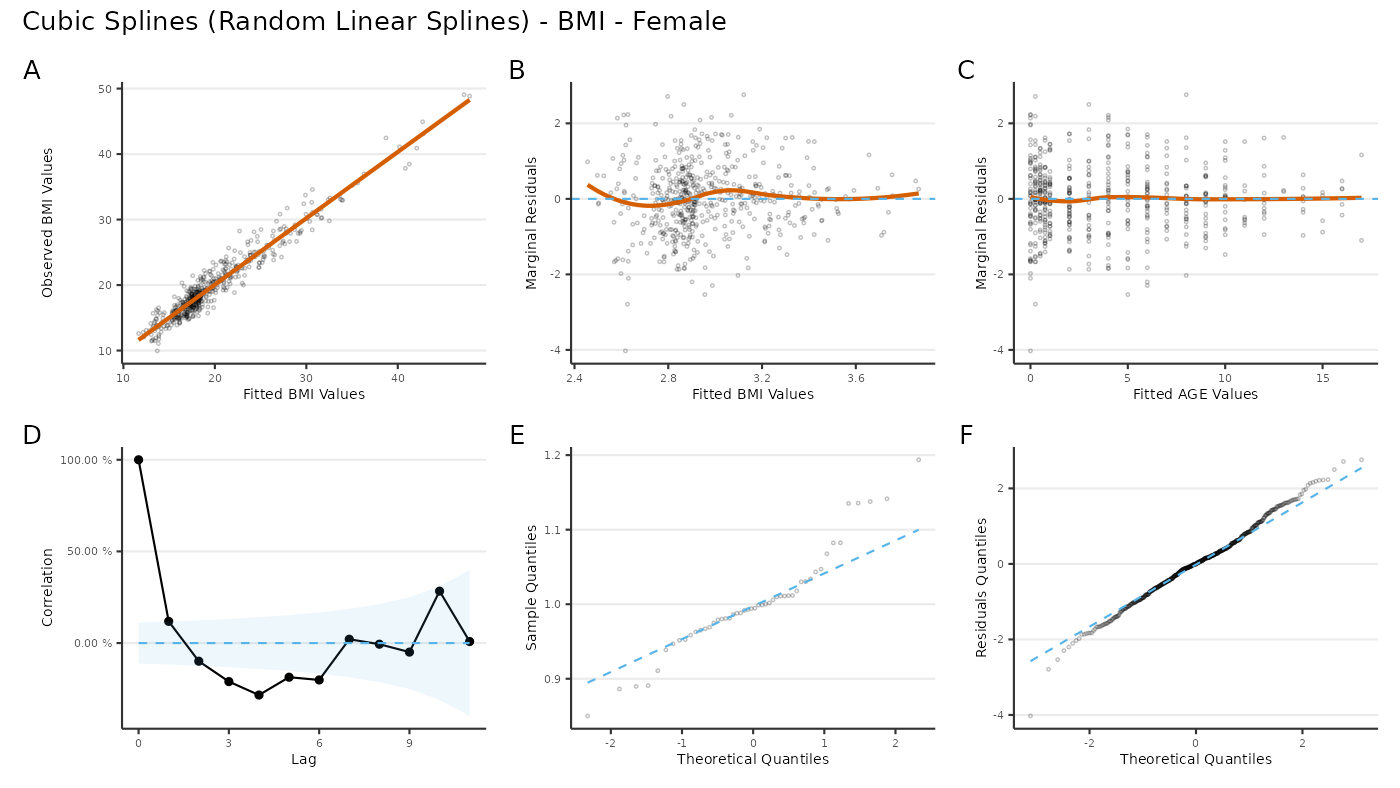
Plot several residuals plots for diagnostics.
Arguments
- x
A length one character vector with the main covariate name (i.e., right-hand side), as defined in
fit.- y
A length one character vector with the variable name to be explained (i.e., left-hand side), as defined in
fit.- fit
A model object from a statistical model such as from a call
time_model()oregg_model().
Examples
library(ggplot2)
library(patchwork)
library(eggla)
data("bmigrowth")
res <- egg_model(
  formula = log(bmi) ~ age,
  data = bmigrowth[bmigrowth[["sex"]] == 0, ],
  id_var = "ID",
  random_complexity = 1
)
#> Fitting model:
#>   nlme::lme(
#>     fixed = log(bmi) ~ gsp(age, knots = c(1, 8, 12), degree = rep(3, 4), smooth = rep(2, 3)),
#>     data = data,
#>     random = ~ gsp(age, knots = c(1, 8, 12), degree = rep(1, 4), smooth = rep(2, 3)) | ID,
#>     na.action = stats::na.omit,
#>     method = "ML",
#>     control = nlme::lmeControl(opt = "optim", niterEM = 25, maxIter = 500, msMaxIter = 500)
#>   )
plot_residuals(
  x = "age",
  y = "log(bmi)",
  fit = res
) +
  plot_annotation(
    title = "Cubic Splines (Random Linear Splines) - BMI - Female",
    tag_levels = "A"
  )