Plot quality-control metrics and thresholds of a "nacho" object
Source:R/autoplot.R
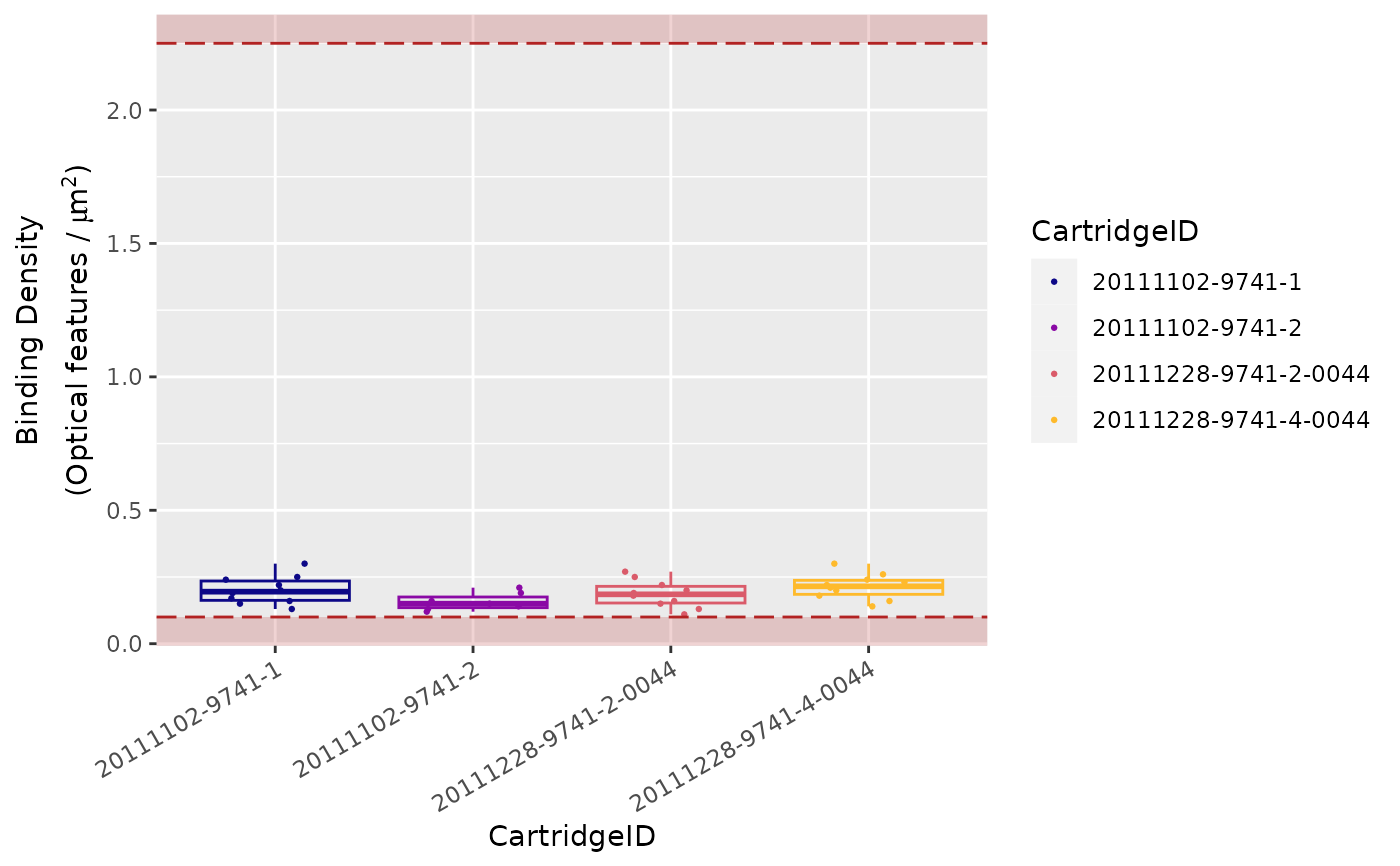
autoplot.nacho.RdThis function allows to plot any qualit-control figures available
within the shiny app using visualise() or in the HTML report from render().
Usage
# S3 method for nacho
autoplot(
  object,
  x,
  colour = "CartridgeID",
  size = 0.5,
  show_legend = TRUE,
  show_outliers = TRUE,
  outliers_factor = 1,
  outliers_labels = NULL,
  ...
)
Arguments
- object
[list] List obtained from
load_rcc()ornormalise().- x
[character] Character string naming the quality-control metrics to plot from
nacho_object. The possible values are:"BD"(Binding Density)"FoV"(Imaging)"PCL"(Positive Control Linearity)"LoD"(Limit of Detection)"Positive"(Positive Controls)"Negative"(Negative Controls)"Housekeeping"(Housekeeping Genes)"PN"(Positive Controls vs. Negative Controls)"ACBD"(Average Counts vs. Binding Density)"ACMC"(Average Counts vs. Median Counts)"PCA12"(Principal Component 1 vs. 2)"PCAi"(Principal Component scree plot)"PCA"(Principal Components planes)"PFNF"(Positive Factor vs. Negative Factor)"HF"(Housekeeping Factor)"NORM"(Normalisation Factor)
- colour
[character] Character string of the column in
ssheet_csvor more generally innacho_object$nachoto be used as grouping colour.- size
[numeric] A numeric controlling point size (
ggplot2::geom_point()or line size (ggplot2::geom_line()).- show_legend
[logical] Boolean to indicate whether the plot legends should be plotted (
TRUE) or not (FALSE). Default isTRUE.- show_outliers
[logical] Boolean to indicate whether the outliers should be highlighted in red (
TRUE) or not (FALSE). Default isTRUE.- outliers_factor
[numeric] Size factor for outliers compared to
size. Default is1.- outliers_labels
[character] Character to indicate which column in
nacho_object$nachoshould be used to be printed as the labels for outliers or not. Default isNULL.- ...
Other arguments (Not used).