Rotating axis tick labels
one categorical
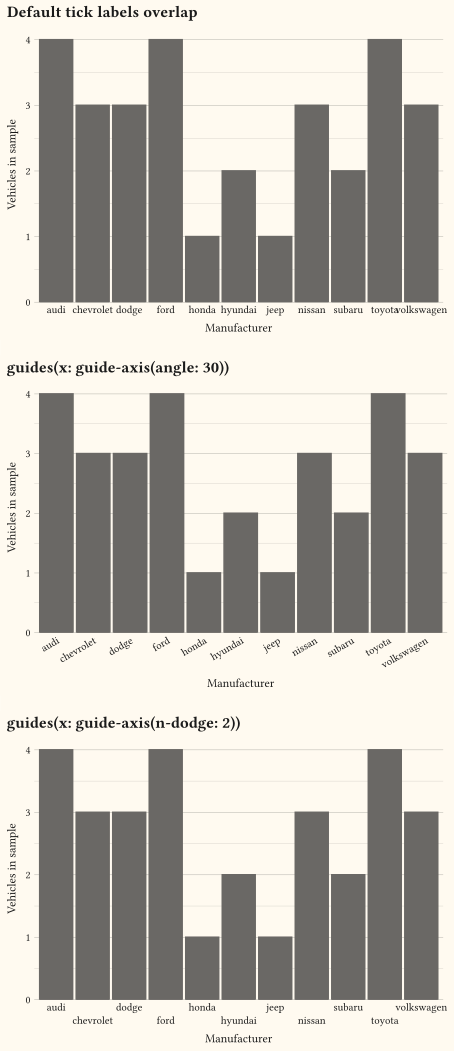
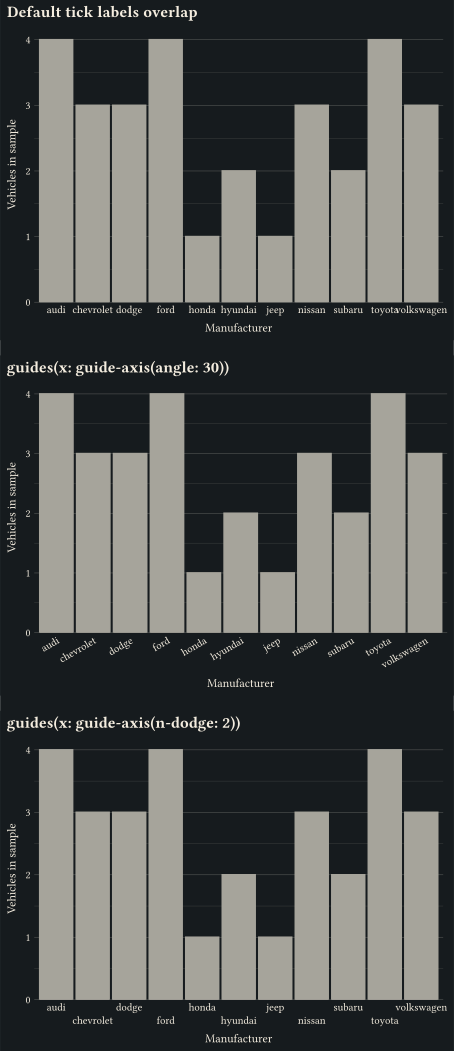
guide-axis rotates or dodges discrete tick labels so long category names stay readable.
Development - This documentation is for the development version of Gribouille. For the stable version, please visit the main documentation.
Control tick labels, axis transforms, and legend layout.
Guides translate scales back into something a reader can decode: axes, legends, and colourbars. These examples rotate and dodge crowded tick labels, add log-scale minor ticks and secondary axes, and control legend order, alignment, and placement down to an arbitrary canvas offset. A guide earns its space only when the reader needs it; drop the legend entirely once series are labelled directly. Every example ships its full source: click View source to copy it.
one categorical
guide-axis rotates or dodges discrete tick labels so long category names stay readable.
two numerics
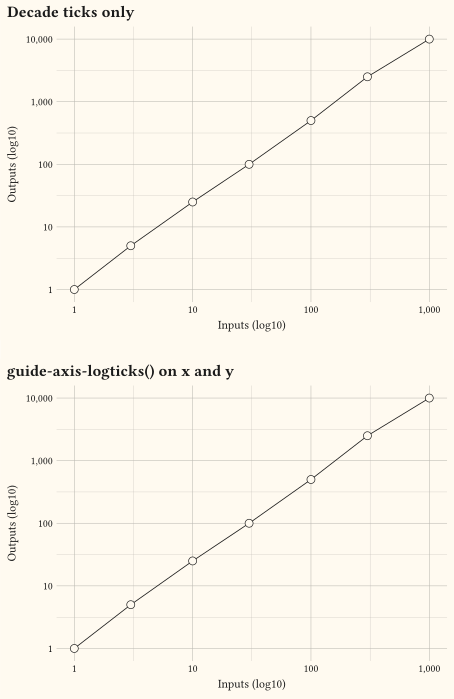
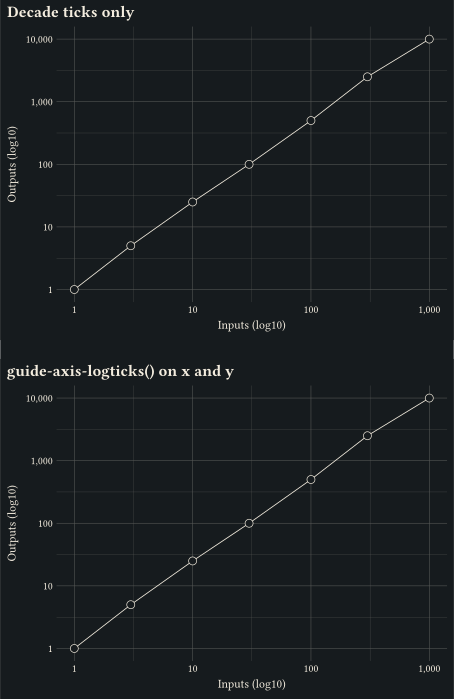
guide-axis-logticks draws minor ticks at log-scale subdivisions on a log10-transformed axis.
two numerics
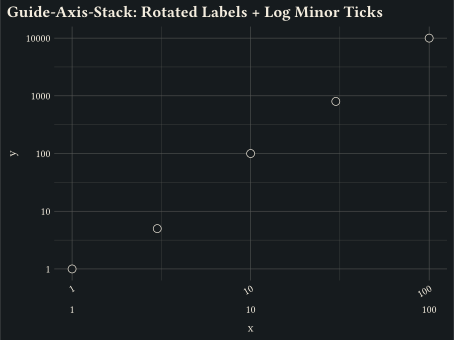
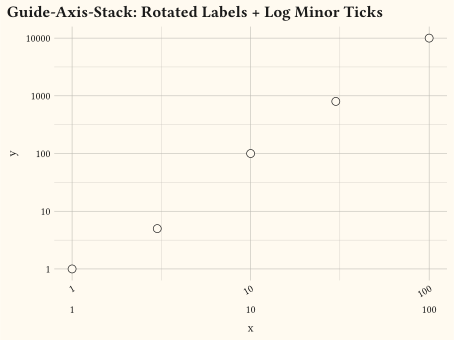
Stack a rotated guide-axis over a guide-axis-logticks pass via guide-axis-stack on the same x axis.
any
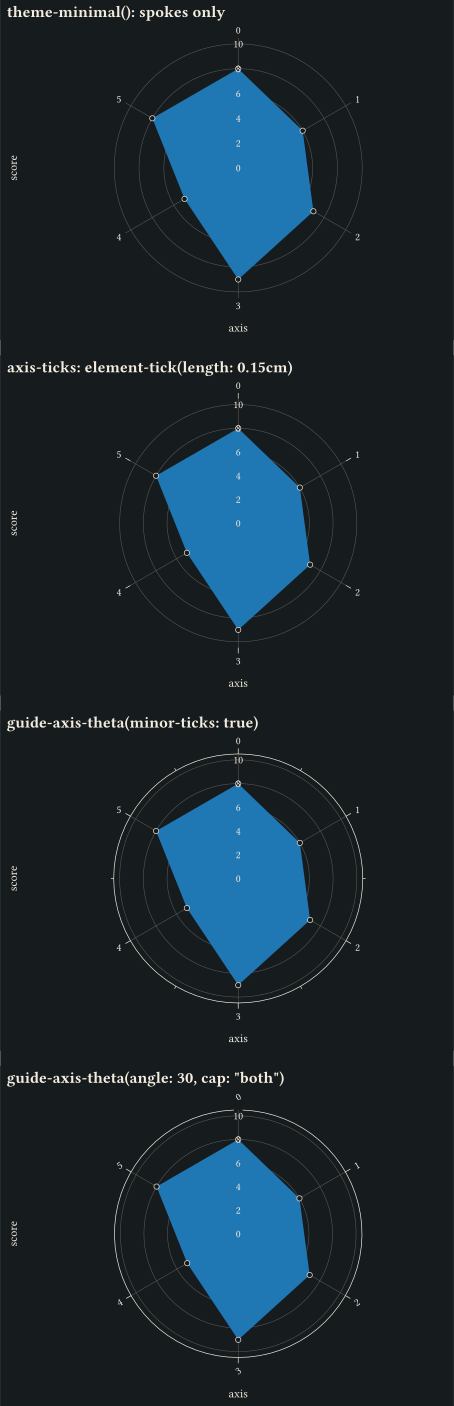
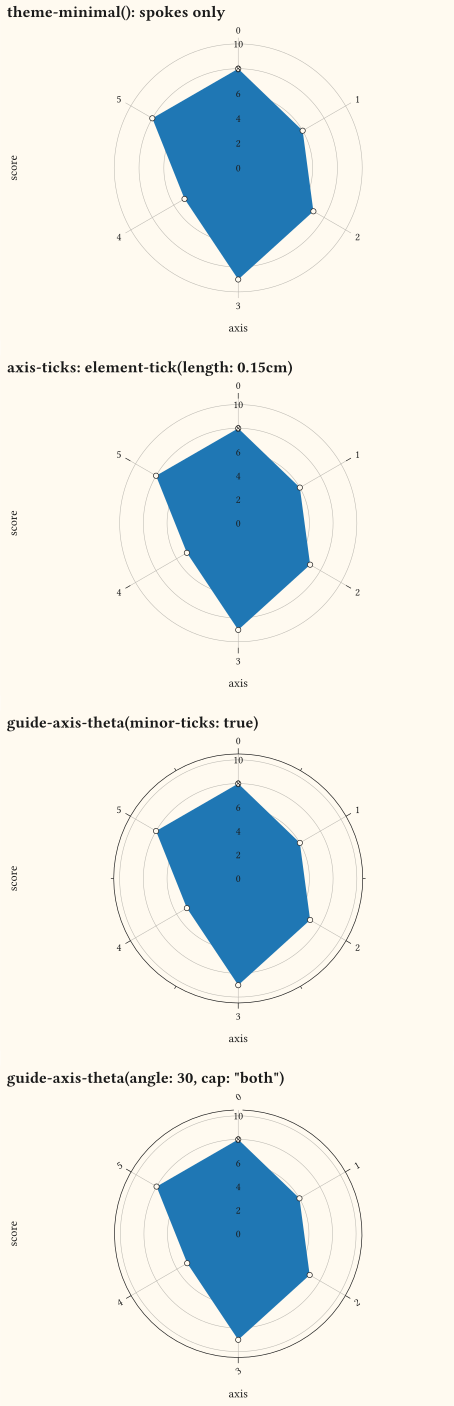
guide-axis-theta rotates radial tick labels, emits half-step minor ticks, and draws an outer axis arc with optional cap.
any
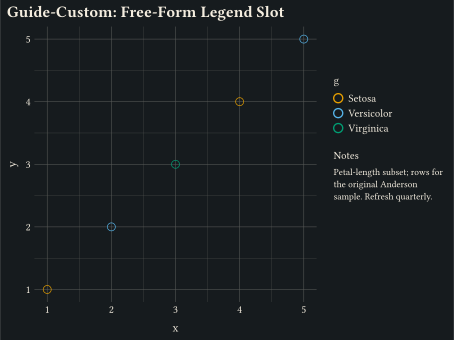
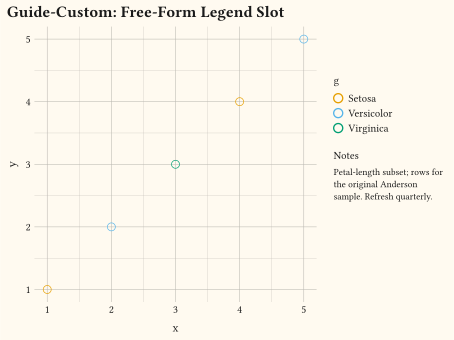
guide-custom drops arbitrary Typst content into the legend area alongside the auto-built colour swatch.
any
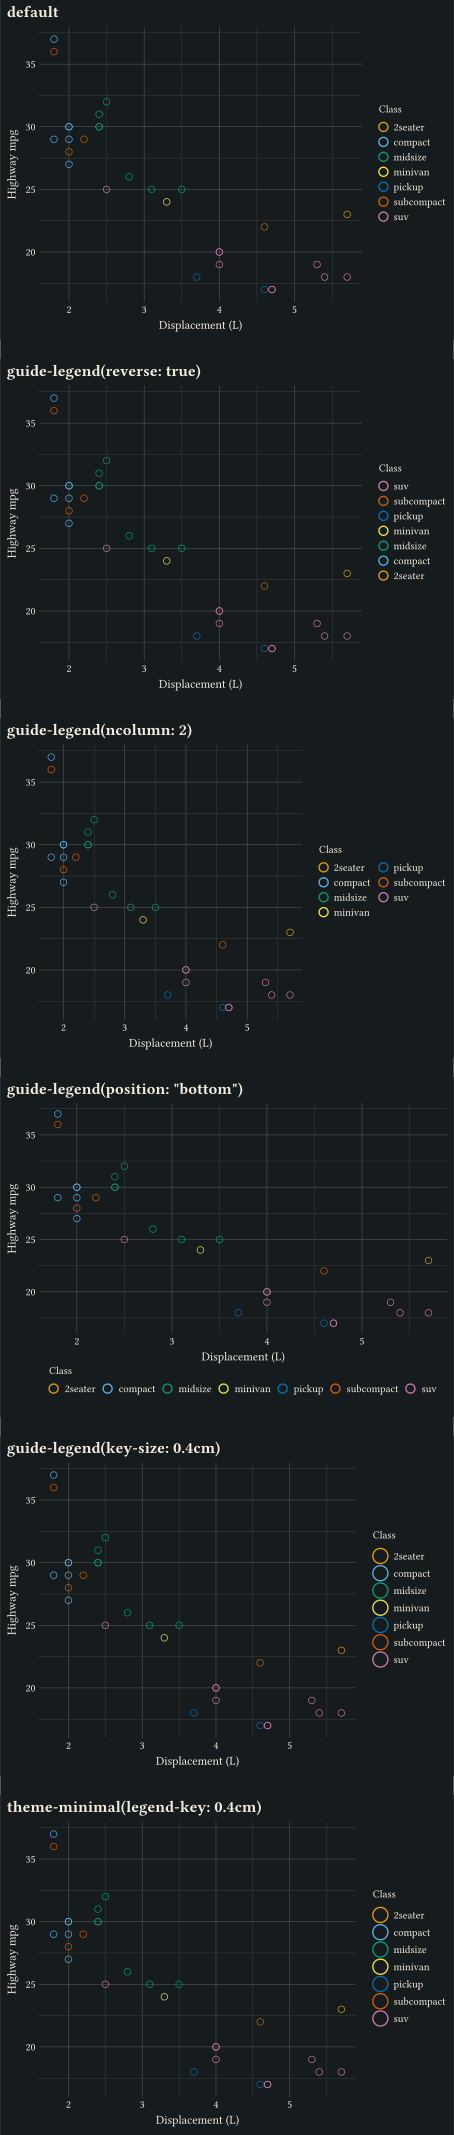
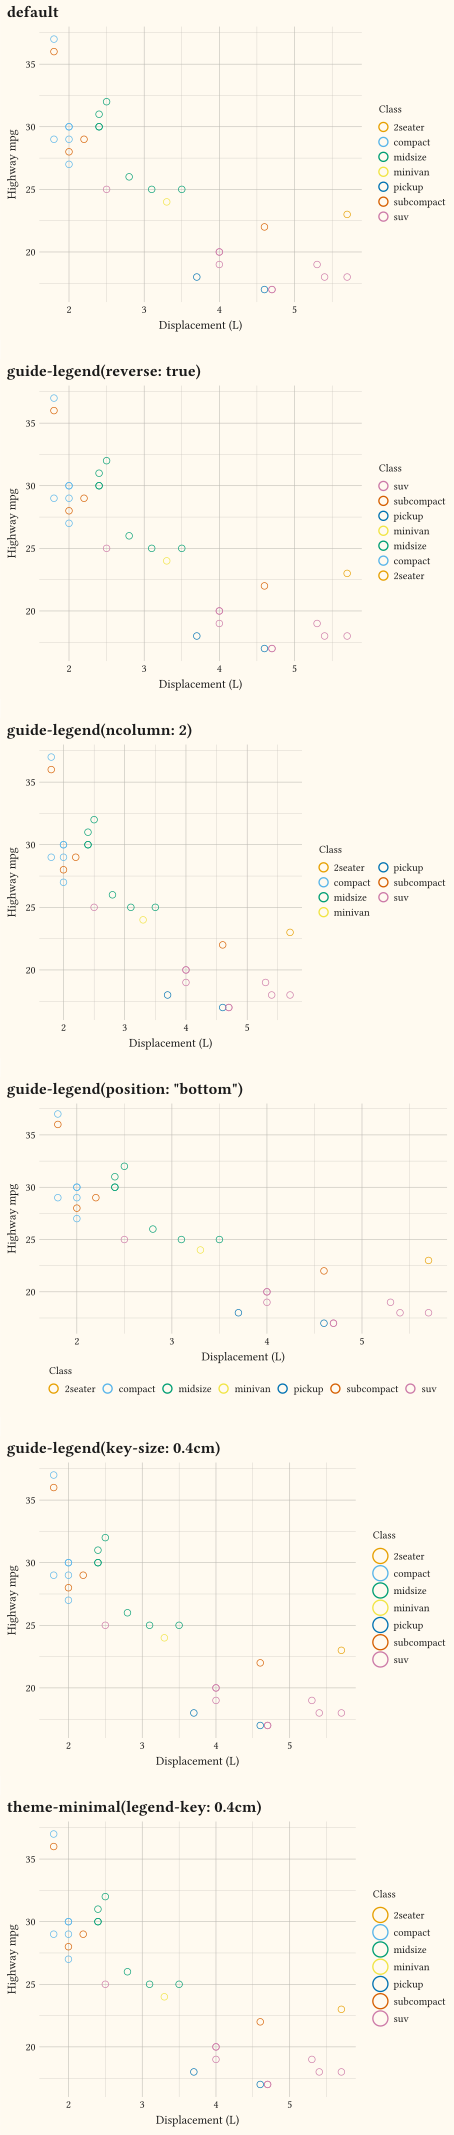
Layout knobs on guide-legend: reverse flips the key order, ncol wraps it onto multiple columns.
any
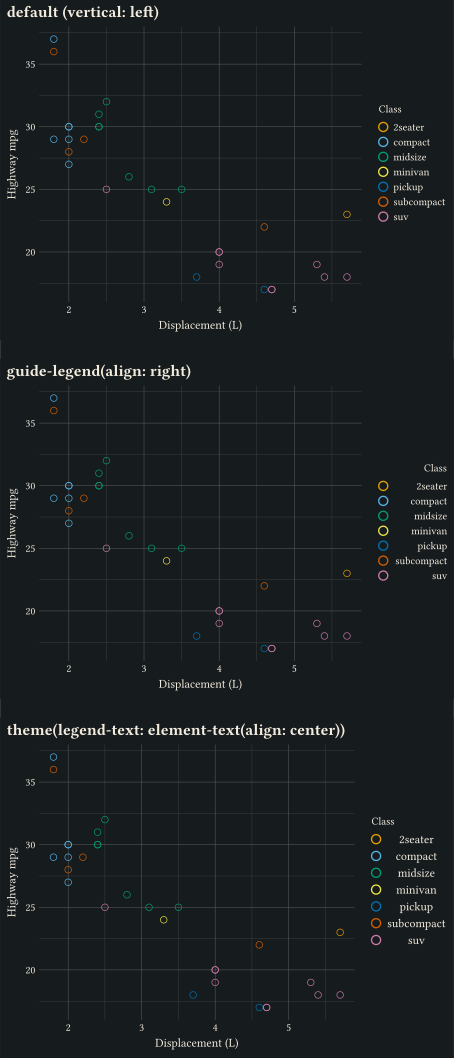
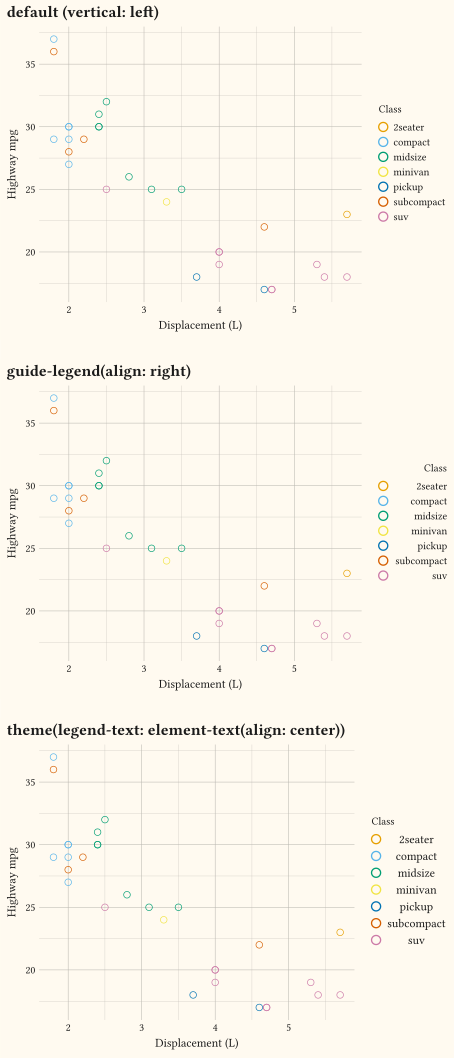
Justify legend entry labels with guide-legend(align:) or theme(legend-text: element-text(align: ...)); horizontal legends centre labels and vertical legends keep them left by default.
any
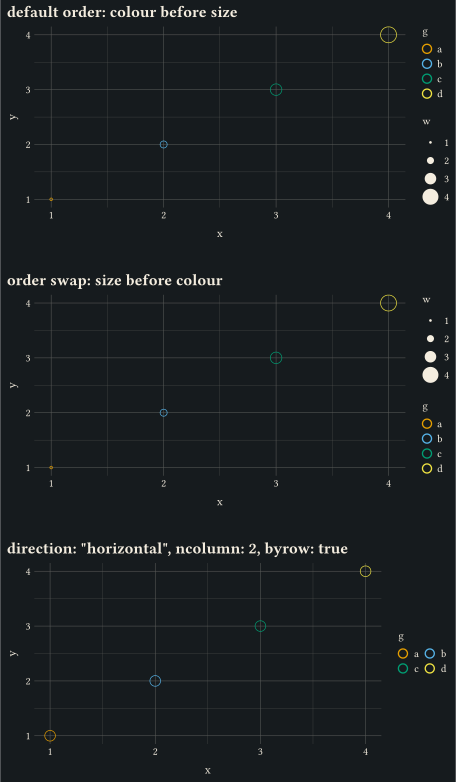
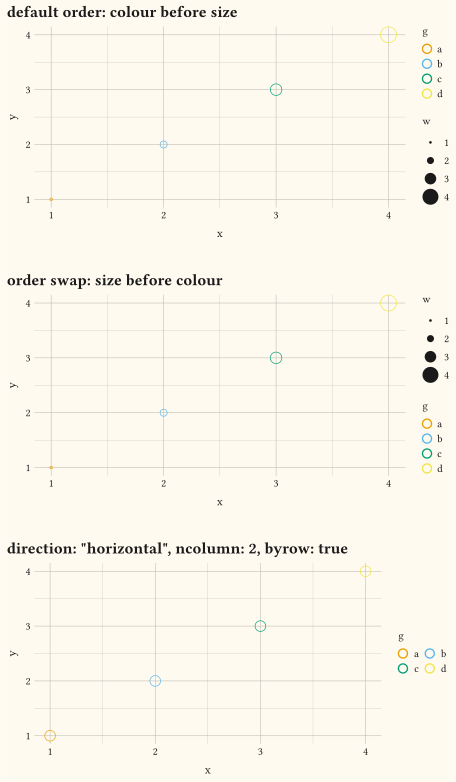
guide-legend order sets stacking priority across aesthetics, while direction and byrow control the swatch grid flow.
any
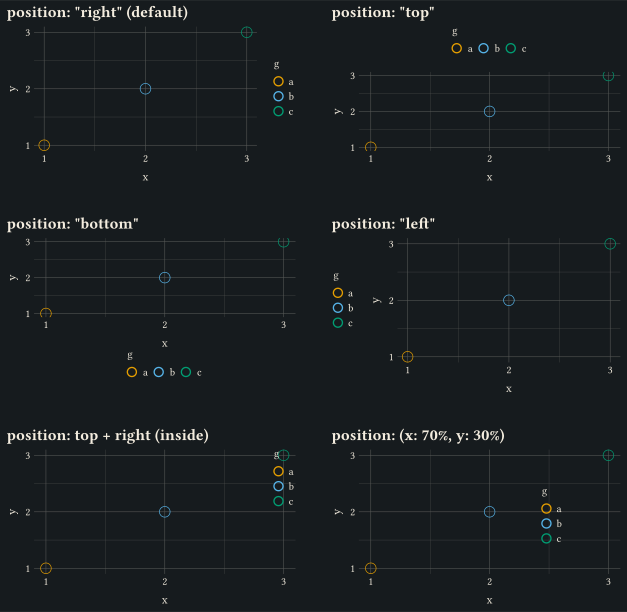
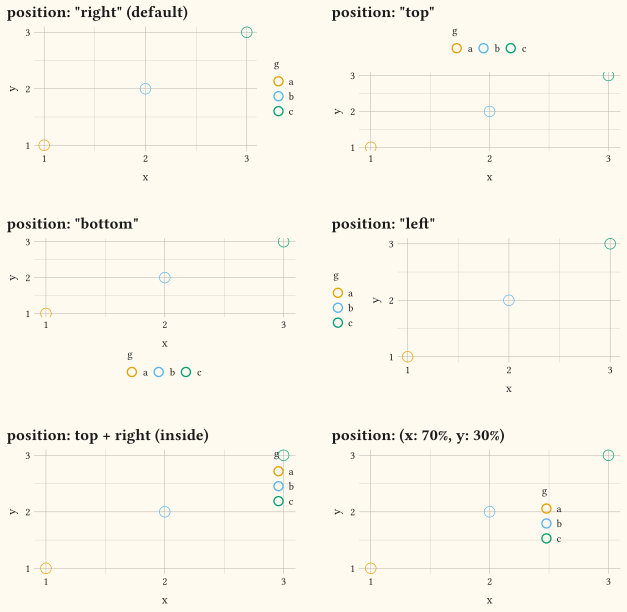
Every guide-legend position value: the four margin sides, an inside corner via a Typst alignment, and an arbitrary (x:, y:) canvas offset.
two numerics
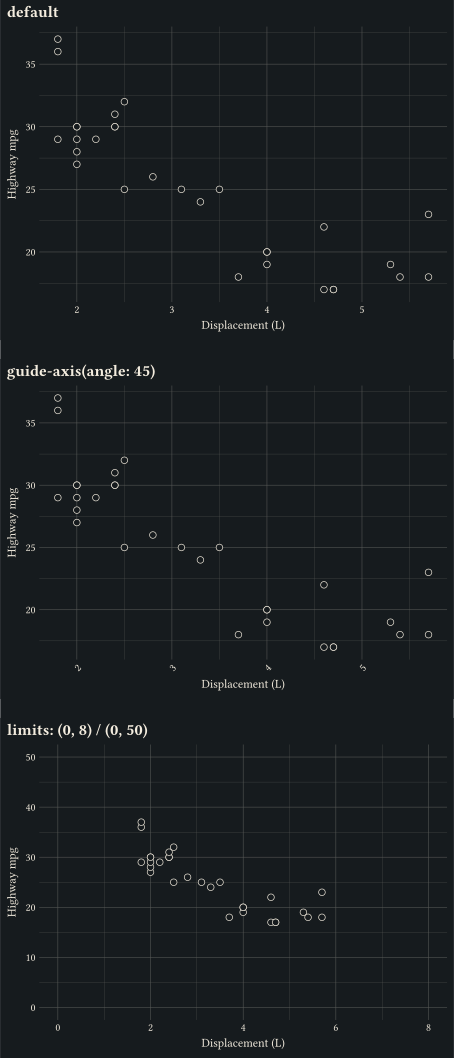
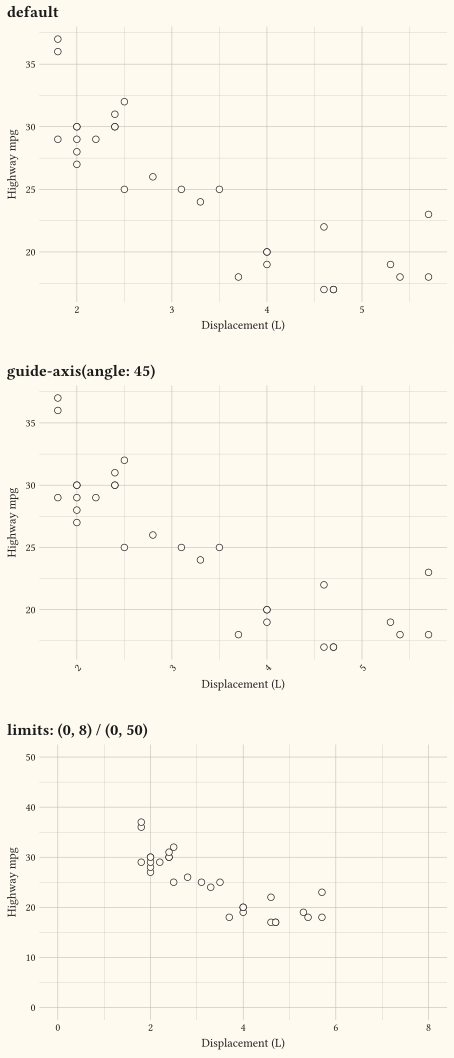
Explicit domains set by scale-continuous(limits:) alongside tidied tick text from guide-axis.
two numerics
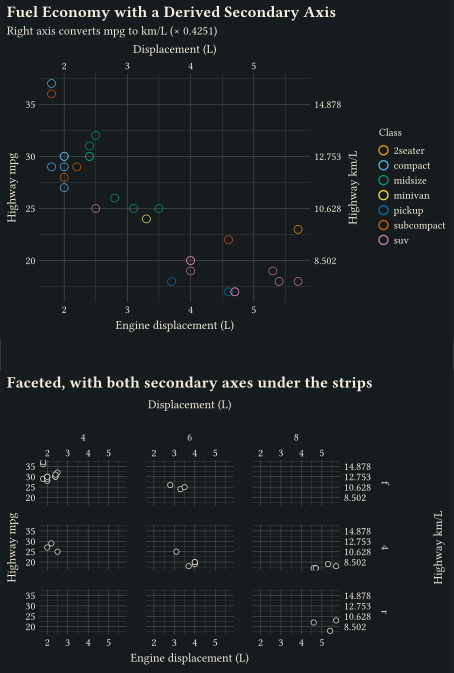
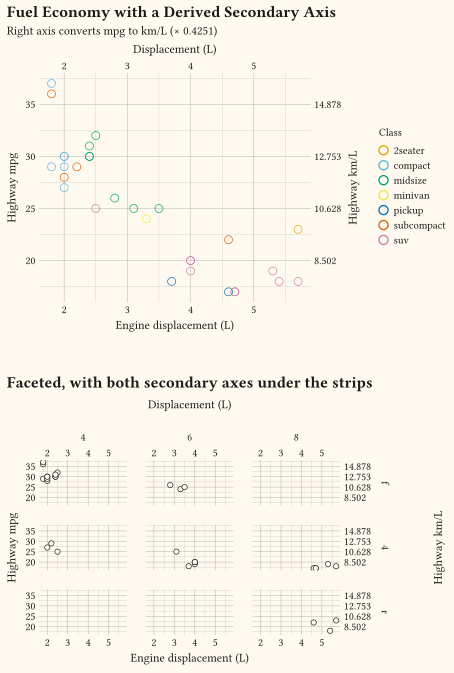
Add a duplicate axis with dup-axis or a derived axis via sec-axis on a continuous scale.
two numerics
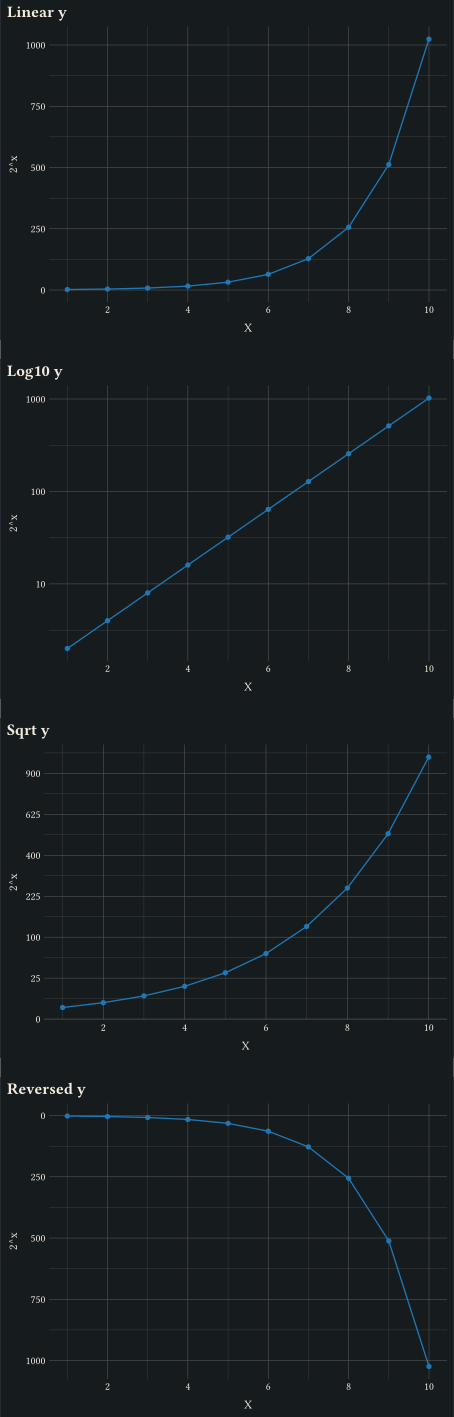
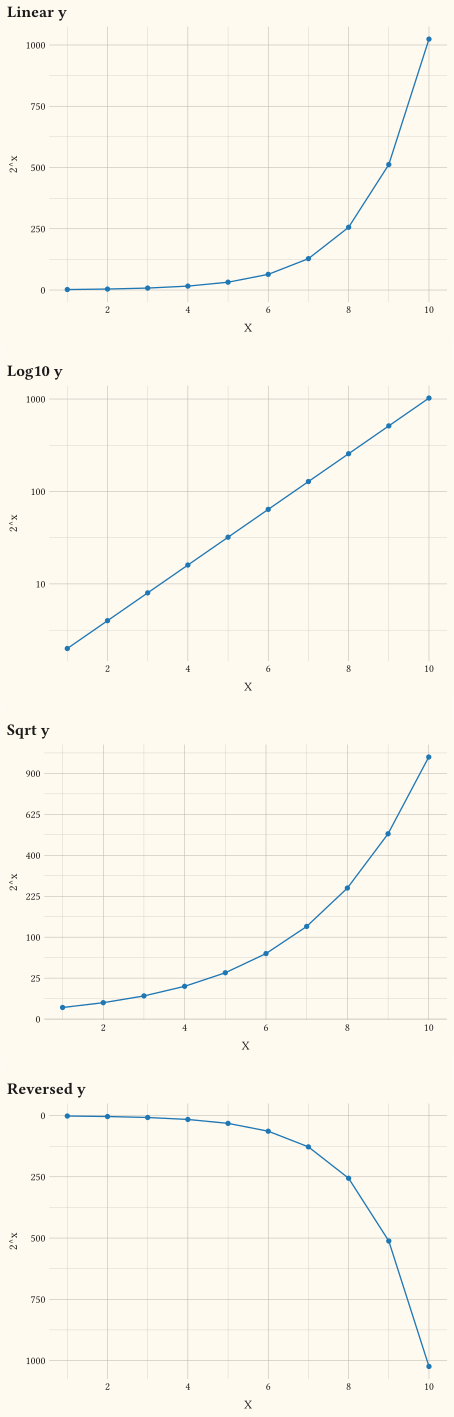
Continuous axis transformations via scale-log10, scale-sqrt, and scale-reverse.
any
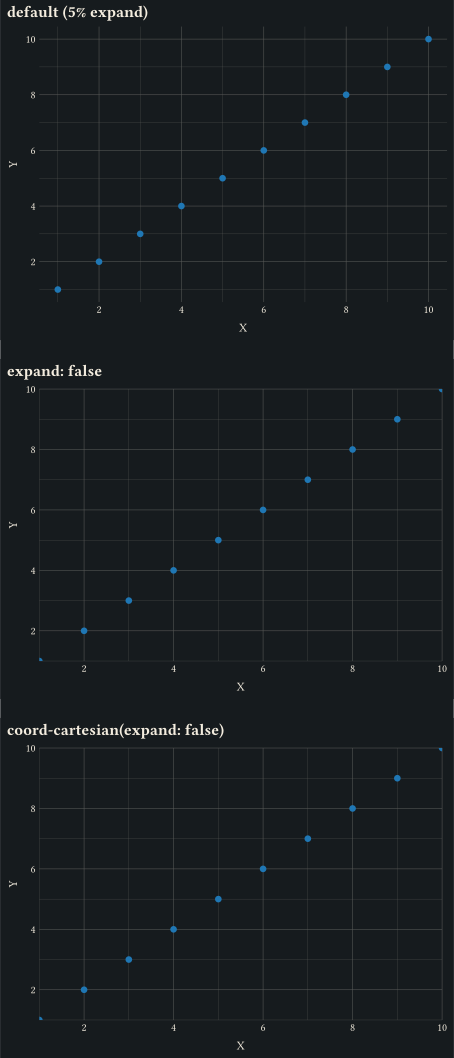
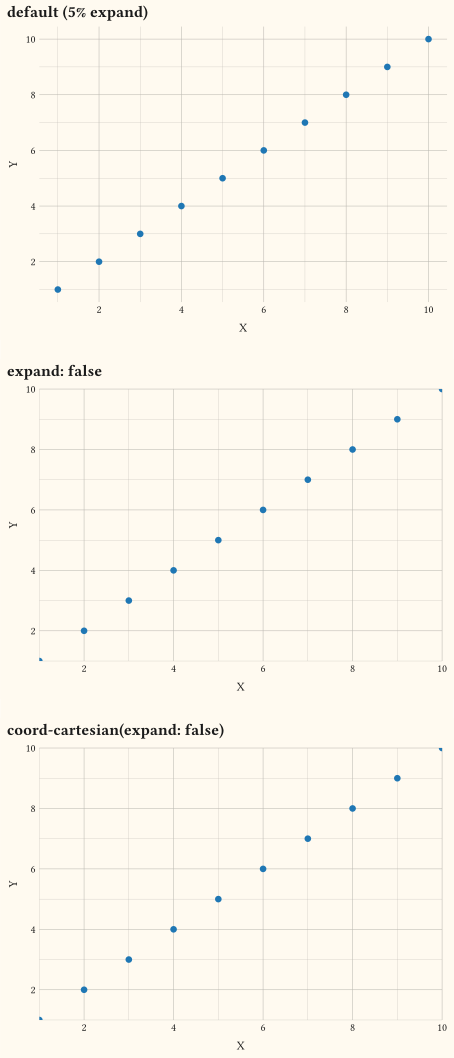
Tune axis breathing room via scale-*-continuous(expand:) or via coord-cartesian(expand: false).
three or more variables
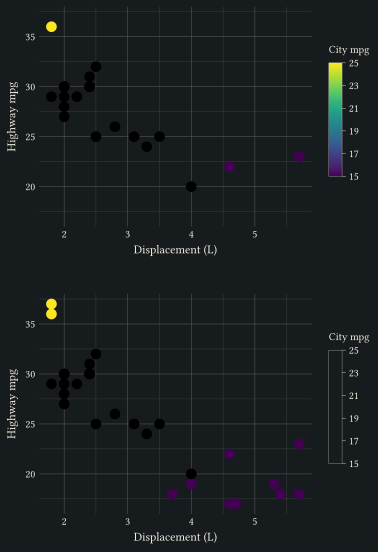
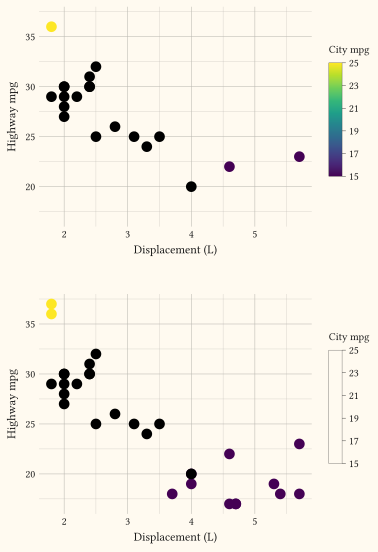
With a scale limits set, oob: "drop" removes out-of-range values while oob: "squish" clamps them to the nearest endpoint of scale-viridis-c.
// guide-axis customises tick label rotation and dodging on a discrete axis.
#import "@preview/gribouille:dev": *
#set page(width: auto, height: auto, margin: 0cm)
#let make-panel(title, gs) = plot(
data: mpg,
mapping: aes(x: "manufacturer"),
layers: (geom-bar(),),
guides: gs,
scales: scales(y: scale-continuous(name: "Vehicles in sample")),
labels: labels(title: title, x: "Manufacturer"),
theme: theme-minimal(),
width: 12cm,
height: 9cm,
)
#grid(
columns: 1,
row-gutter: 0.4cm,
make-panel("Default tick labels overlap", (:)),
make-panel("guides(x: guide-axis(angle: 30))", guides(
x: guide-axis(angle: 30),
)),
make-panel("guides(x: guide-axis(n-dodge: 2))", guides(
x: guide-axis(n-dodge: 2),
)),
)// guide-axis-logticks adds minor ticks at log-scale subdivisions on a log10 axis.
#import "@preview/gribouille:dev": *
#set page(width: auto, height: auto, margin: 0cm)
#let d = (
(x: 1, y: 1),
(x: 3, y: 5),
(x: 10, y: 25),
(x: 30, y: 100),
(x: 100, y: 500),
(x: 300, y: 2500),
(x: 1000, y: 10000),
)
#let panel(title, gs) = plot(
data: d,
mapping: aes(x: "x", y: "y"),
layers: (
geom-line(stroke: 0.6pt, alpha: 0.4),
geom-point(size: 3pt),
),
scales: scales(x: scale-continuous(transform: "log10", labels: format-comma()), y: scale-continuous(transform: "log10", labels: format-comma())),
guides: gs,
labels: labels(title: title, x: "Inputs (log10)", y: "Outputs (log10)"),
theme: theme-minimal(),
width: 12cm,
height: 9cm,
)
#grid(
columns: 1,
row-gutter: 0.5cm,
panel("Decade ticks only", (:)),
panel(
"guide-axis-logticks() on x and y",
guides(x: guide-axis-logticks(), y: guide-axis-logticks()),
),
)// guide-axis-stack pairs a rotated-label pass with the log-tick minor pass
// on the same axis: one row carries readable labels, the next adds dense
// minor ticks below.
#import "@preview/gribouille:dev": *
#set page(width: auto, height: auto, margin: 0cm)
#let d = (
(x: 1, y: 1),
(x: 3, y: 5),
(x: 10, y: 100),
(x: 30, y: 800),
(x: 100, y: 10000),
)
#plot(
data: d,
mapping: aes(x: "x", y: "y"),
layers: (geom-point(size: 3pt),),
scales: scales(x: scale-continuous(transform: "log10"), y: scale-continuous(transform: "log10")),
guides: guides(
x: guide-axis-stack(
guides: (
guide-axis(angle: 30),
guide-axis-logticks(),
),
spacing: 6pt,
),
),
labels: labels(title: "Guide-Axis-Stack: Rotated Labels + Log Minor Ticks"),
theme: theme-minimal(),
width: 12cm,
height: 9cm,
)// guide-axis-theta customises the angular axis under coord-radial: rotate
// theta tick labels, emit minor ticks at half-step positions, and draw an
// outer axis arc that respects the active theta range. The arc reads the
// `axis-line` theme surface and the ticks read `axis-ticks`, both of which
// theme-minimal blanks, so the panels below turn them back on.
#import "@preview/gribouille:dev": *
#set page(width: auto, height: auto, margin: 0cm)
#let scores = (8, 6, 7, 9, 5, 8)
#let car = range(scores.len()).map(i => (axis: i, score: scores.at(i)))
#let ringed = theme-minimal(
axis-line: element-line(stroke: 0.5pt),
axis-ticks: element-tick(length: 0.15cm),
)
#let make-panel(title, gs, theme: ringed) = plot(
data: car,
mapping: aes(x: "axis", y: "score"),
layers: (
geom-polygon(fill: rgb("#1f77b4"), alpha: 0.4, stroke: 0.8pt),
geom-point(size: 2pt),
),
coord: coord-radial(theta: "x"),
scales: scales(
x: scale-continuous(
limits: (0, 6),
labels: v => if v == 6 { none } else { str(v) },
expand: false,
),
y: scale-continuous(limits: (0, 10)),
),
guides: gs,
labels: labels(title: title),
theme: theme,
width: 12cm,
height: 9cm,
)
#grid(
columns: 1,
row-gutter: 0.4cm,
make-panel("theme-minimal(): spokes only", (:), theme: theme-minimal()),
make-panel("axis-ticks: element-tick(length: 0.15cm)", (:)),
make-panel("guide-axis-theta(minor-ticks: true)", guides(
theta: guide-axis-theta(minor-ticks: true),
)),
make-panel("guide-axis-theta(angle: 30, cap: \"both\")", guides(
theta: guide-axis-theta(angle: 30, cap: "both"),
)),
)// guide-custom drops arbitrary Typst content into the legend area alongside
// the auto-built colour swatch.
#import "@preview/gribouille:dev": *
#set page(width: auto, height: auto, margin: 0cm)
#let d = (
(x: 1, y: 1, g: "Setosa"),
(x: 2, y: 2, g: "Versicolor"),
(x: 3, y: 3, g: "Virginica"),
(x: 4, y: 4, g: "Setosa"),
(x: 5, y: 5, g: "Versicolor"),
)
#plot(
data: d,
mapping: aes(x: "x", y: "y", colour: "g"),
layers: (geom-point(size: 3pt),),
guides: guides(
note: guide-custom(
[
#set text(size: 7pt)
Petal-length subset; rows for the original Anderson sample. Refresh quarterly.
],
width: 3cm,
height: auto,
title: "Notes",
),
),
labels: labels(title: "Guide-Custom: Free-Form Legend Slot"),
theme: theme-minimal(),
width: 12cm,
height: 9cm,
)// guide-legend(): customise per-aesthetic legends; pass `none` to suppress one.
#import "@preview/gribouille:dev": *
#set page(width: auto, height: auto, margin: 0cm)
#let make-panel(title, gs, th: theme-minimal()) = plot(
data: mpg,
mapping: aes(x: "displ", y: "hwy", colour: "class"),
layers: (geom-point(size: 2.5pt),),
guides: gs,
labels: labels(
title: title,
x: "Displacement (L)",
y: "Highway mpg",
colour: "Class",
),
theme: th,
width: 12cm,
height: 9cm,
)
#grid(
columns: 1,
row-gutter: 0.5cm,
make-panel("default", (:)),
make-panel("guide-legend(reverse: true)", guides(
colour: guide-legend(reverse: true),
)),
make-panel("guide-legend(ncolumn: 2)", guides(
colour: guide-legend(ncolumn: 2),
)),
make-panel(
"guide-legend(position: \"bottom\")",
guides(colour: guide-legend(position: "bottom")),
),
make-panel(
"guide-legend(key-size: 0.4cm)",
guides(colour: guide-legend(key-size: 0.4cm)),
),
make-panel(
"theme-minimal(legend-key: 0.4cm)",
(:),
th: theme-minimal(legend-key: 0.4cm),
),
)// guide-legend(align:) and the legend-text align: justify entry labels.
#import "@preview/gribouille:dev": *
#set page(width: auto, height: auto, margin: 0cm)
#let make-panel(title, ..args) = plot(
data: mpg,
mapping: aes(x: "displ", y: "hwy", colour: "class"),
layers: (geom-point(size: 2.5pt),),
labels: labels(
title: title,
x: "Displacement (L)",
y: "Highway mpg",
colour: "Class",
),
theme: theme-minimal(),
width: 12cm,
height: 9cm,
..args,
)
#grid(
columns: 1,
row-gutter: 0.5cm,
make-panel("default (vertical: left)"),
make-panel(
"guide-legend(align: right)",
guides: guides(colour: guide-legend(align: right)),
),
make-panel(
"theme(legend-text: element-text(align: center))",
theme: theme-minimal() + theme(legend-text: element-text(align: center)),
),
)// guide-legend(order:, direction:, byrow:): stacking priority and grid flow.
//
// `order` overrides the default aesthetic order (colour, fill, size, ...);
// `direction` flips the swatch flow between vertical and horizontal;
// `byrow` switches the grid fill from column-major to row-major.
#import "@preview/gribouille:dev": *
#set page(width: auto, height: auto, margin: 0cm)
#let d = (
(x: 1, y: 1, g: "a", w: 1),
(x: 2, y: 2, g: "b", w: 2),
(x: 3, y: 3, g: "c", w: 3),
(x: 4, y: 4, g: "d", w: 4),
)
#grid(
columns: 1,
row-gutter: 0.6cm,
plot(
data: d,
mapping: aes(x: "x", y: "y", colour: "g", size: "w"),
layers: (geom-point(),),
labels: labels(title: "default order: colour before size"),
width: 12cm,
height: 6.5cm,
),
plot(
data: d,
mapping: aes(x: "x", y: "y", colour: "g", size: "w"),
layers: (geom-point(),),
guides: guides(
colour: guide-legend(order: 2),
size: guide-legend(order: 1),
),
labels: labels(title: "order swap: size before colour"),
width: 12cm,
height: 6.5cm,
),
plot(
data: d,
mapping: aes(x: "x", y: "y", colour: "g"),
layers: (geom-point(size: 4pt),),
guides: guides(colour: guide-legend(
direction: "horizontal",
ncolumn: 2,
byrow: true,
)),
labels: labels(title: "direction: \"horizontal\", ncolumn: 2, byrow: true"),
width: 12cm,
height: 6.5cm,
),
)// guide-legend(position: ...): every accepted placement value.
//
// The four side strings push the legend into the matching margin; a Typst
// alignment (e.g. top + right) places it inside the panel anchored to that
// corner; a dict (x:, y:) / (dx:, dy:) offsets it anywhere on the canvas.
#import "@preview/gribouille:dev": *
#set page(width: auto, height: auto, margin: 0cm)
#let d = (
(x: 1, y: 1, g: "a"),
(x: 2, y: 2, g: "b"),
(x: 3, y: 3, g: "c"),
)
#let make-panel(title, pos) = plot(
data: d,
mapping: aes(x: "x", y: "y", colour: "g"),
layers: (geom-point(size: 4pt),),
guides: guides(colour: guide-legend(position: pos)),
labels: labels(title: title),
width: 8cm,
height: 5cm,
)
#grid(
columns: 2,
column-gutter: 0.6cm,
row-gutter: 0.6cm,
make-panel("position: \"right\" (default)", "right"),
make-panel("position: \"top\"", "top"),
make-panel("position: \"bottom\"", "bottom"),
make-panel("position: \"left\"", "left"),
make-panel("position: top + right (inside)", top + right),
make-panel("position: (x: 70%, y: 30%)", (x: 70%, y: 30%)),
)// scale-*-continuous(limits:) sets explicit data domains; guide-axis tweaks tick text.
#import "@preview/gribouille:dev": *
#set page(width: auto, height: auto, margin: 0cm)
#let base(title, extra-scales: (:), extra-guides: (:)) = plot(
data: mpg,
mapping: aes(x: "displ", y: "hwy"),
layers: (geom-point(size: 2.5pt, alpha: 0.7),),
scales: extra-scales,
guides: extra-guides,
labels: labels(title: title, x: "Displacement (L)", y: "Highway mpg"),
theme: theme-minimal(),
width: 12cm,
height: 9cm,
)
#grid(
columns: 1,
row-gutter: 0.5cm,
base("default"),
base(
"guide-axis(angle: 45)",
extra-guides: guides(x: guide-axis(angle: 45)),
),
base(
"limits: (0, 8) / (0, 50)",
extra-scales: scales(x: scale-continuous(limits: (0, 8)), y: scale-continuous(limits: (0, 50))),
),
)// dup-axis duplicates an axis; sec-axis derives a transformed companion.
#import "@preview/gribouille:dev": *
#set page(width: auto, height: auto, margin: 0cm)
#stack(
dir: ttb,
spacing: 0.8cm,
plot(
data: mpg,
mapping: aes(x: "displ", y: "hwy", colour: "class"),
layers: (geom-point(size: 3pt, alpha: 0.8),),
scales: scales(
x: scale-continuous(
name: "Engine displacement (L)",
secondary: dup-axis(name: "Displacement (L)"),
),
y: scale-continuous(name: "Highway mpg", secondary: sec-axis(
transform: v => v * 0.4251,
name: "Highway km/L",
)),
),
labels: labels(
title: "Fuel Economy with a Derived Secondary Axis",
subtitle: "Right axis converts mpg to km/L (× 0.4251)",
colour: "Class",
),
theme: theme-minimal(),
width: 12cm,
height: 9cm,
),
// Under facets each secondary axis is drawn between the panel grid and the
// strip band on that side, with its title once at the edge of the grid.
plot(
data: mpg,
mapping: aes(x: "displ", y: "hwy"),
layers: (geom-point(size: 2pt, alpha: 0.8),),
facet: facet-grid(rows: "drv", columns: "cyl"),
scales: scales(
x: scale-continuous(
name: "Engine displacement (L)",
secondary: dup-axis(name: "Displacement (L)"),
),
y: scale-continuous(
name: "Highway mpg",
secondary: sec-axis(transform: v => v * 0.4251, name: "Highway km/L"),
),
),
labels: labels(title: "Faceted, with both secondary axes under the strips"),
theme: theme-minimal(),
width: 12cm,
height: 8cm,
),
)// Continuous axis transformations: log10, sqrt, and reverse on the y axis.
#import "@preview/gribouille:dev": *
#set page(width: auto, height: auto, margin: 0cm)
#let accent = rgb("#1f77b4")
#let d = range(1, 11).map(i => (x: i, y: calc.pow(2, i)))
#let panel(title, scales) = plot(
data: d,
mapping: aes(x: "x", y: "y"),
layers: (
geom-line(stroke: 1pt, colour: accent),
geom-point(size: 2pt, fill: accent),
),
scales: scales,
labels: labels(title: title, x: "X", y: "2^x"),
theme: theme-minimal(),
width: 12cm,
height: 9cm,
)
#grid(
columns: 1,
row-gutter: 0.5cm,
panel("Linear y", (:)),
panel("Log10 y", scales(y: scale-log10())),
panel("Sqrt y", scales(y: scale-sqrt())),
panel("Reversed y", scales(y: scale-reverse())),
)// scale-*-continuous(expand:) and coord-cartesian(expand: false) tune
// the breathing room around the data.
#import "@preview/gribouille:dev": *
#set page(width: auto, height: auto, margin: 0cm)
#let pts = range(1, 11).map(i => (x: i, y: i))
#let base(title, scales: (:), coord-arg: none) = plot(
data: pts,
mapping: aes(x: "x", y: "y"),
layers: (geom-point(size: 2.5pt, fill: rgb("#1f77b4")),),
scales: scales,
coord: coord-arg,
labels: labels(title: title, x: "X", y: "Y"),
theme: theme-minimal(),
width: 12cm,
height: 9cm,
)
#grid(
columns: 1,
row-gutter: 0.5cm,
base("default (5% expand)"),
base(
"expand: false",
scales: scales(x: scale-continuous(expand: false), y: scale-continuous(expand: false)),
),
base(
"coord-cartesian(expand: false)",
coord-arg: coord-cartesian(expand: false),
),
)// Out-of-range handling when a scale `limits` is set.
//
// Default `oob: "drop"` removes rows whose mapped value falls outside the
// limits; `oob: "squish"` clamps them to the nearest endpoint instead.
#import "@preview/gribouille:dev": *
#set page(width: auto, height: auto, margin: 0cm)
#let base(extra-scales) = plot(
data: mpg,
mapping: aes(x: "displ", y: "hwy", fill: "cty"),
layers: (geom-point(size: 4pt, alpha: 0.85),),
scales: extra-scales,
labels: labels(
x: "Displacement (L)",
y: "Highway mpg",
fill: "City mpg",
),
theme: theme-minimal(),
width: 10cm,
height: 7cm,
)
#grid(
columns: 1,
row-gutter: 0.6cm,
base(scales(fill: scale-viridis-c(limits: (15, 25)))),
base(scales(fill: scale-viridis-c(limits: (15, 25), oob: "squish"))),
)