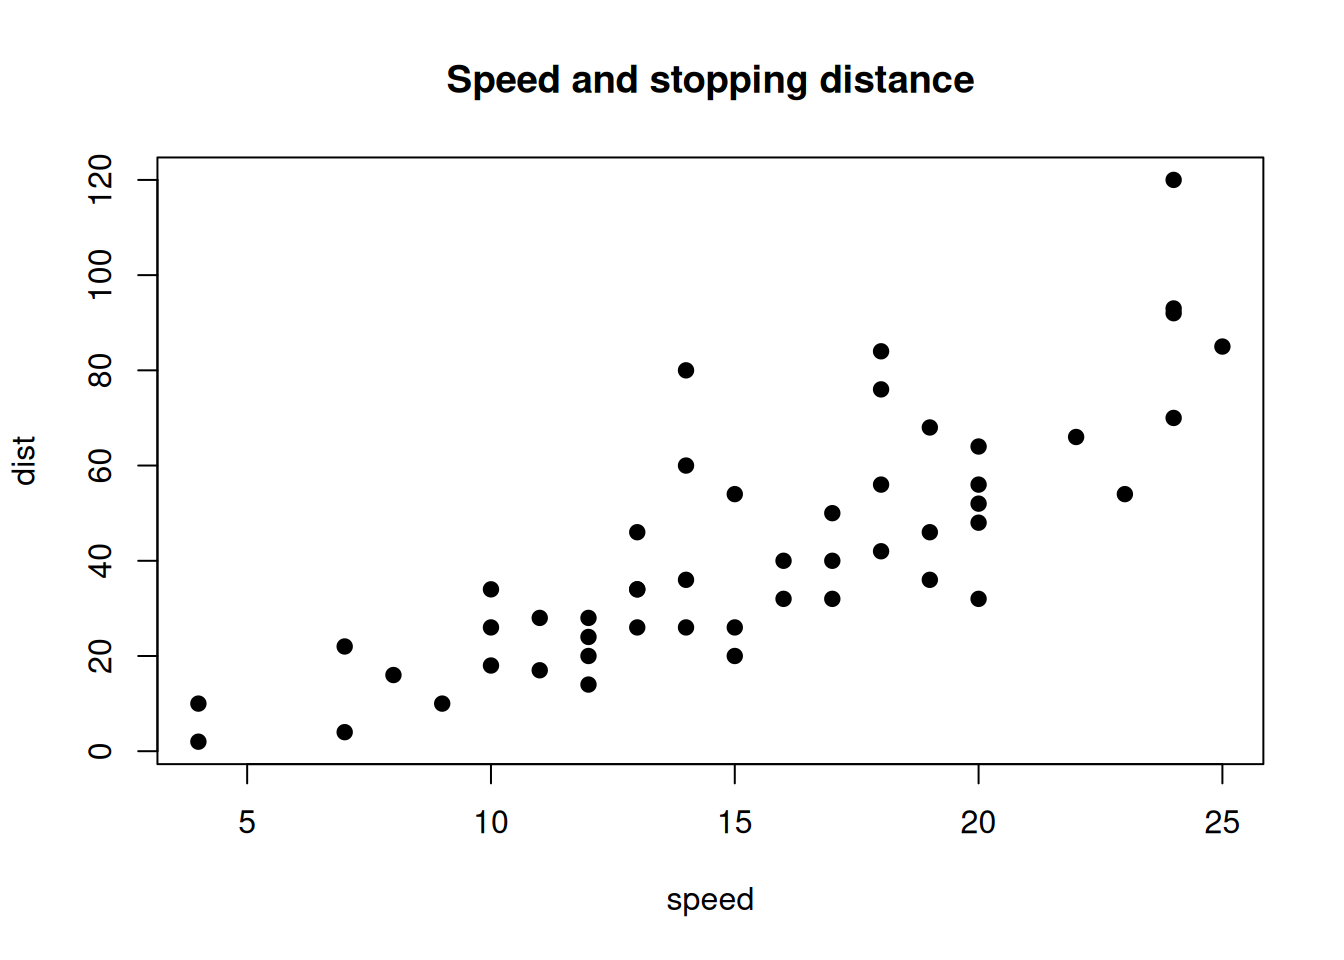
The collapse-output filter folding output from R cells, showing that it works on what Quarto emits rather than on any one engine.
The Examples page runs Python through Jupyter. This one runs R through knitr, from the renv environment declared at the repository root.
The filter acts on the cell and cell-output elements Quarto emits, which are the same whichever engine produced them, so nothing here is configured differently.
Folding one cell
```{r}#| output-fold: truesummary(cars)```
Standard Output (7 lines)
     speed           dist
 Min.   : 4.0   Min.   :  2.00
 1st Qu.:12.0   1st Qu.: 26.00
 Median :15.0   Median : 36.00
 Mean   :15.4   Mean   : 42.98
 3rd Qu.:19.0   3rd Qu.: 56.00
 Max.   :25.0   Max.   :120.00
The summary comes from summary-template, set once for the whole site, and its line count is measured from the output above.
A summary of your own
```{r}#| output-fold: true#| output-summary: "Click to view the model"summary(lm(dist ~ speed, data = cars))```
Click to view the model
Call:
lm(formula = dist ~ speed, data = cars)

Residuals:
    Min      1Q  Median      3Q     Max
-29.069  -9.525  -2.272   9.215  43.201

Coefficients:
            Estimate Std. Error t value Pr(>|t|)
(Intercept) -17.5791     6.7584  -2.601   0.0123 *
speed         3.9324     0.4155   9.464 1.49e-12 ***
---
Signif. codes:  0 '***' 0.001 '**' 0.01 '*' 0.05 '.' 0.1 ' ' 1

Residual standard error: 15.38 on 48 degrees of freedom
Multiple R-squared:  0.6511,    Adjusted R-squared:  0.6438
F-statistic: 89.57 on 1 and 48 DF,  p-value: 1.49e-12