// Gribouille comes from the typst-render preamble (assets/typst/_preamble.typ),
// so this file does not import it.
// #import "@preview/gribouille:0.7.0": *
// #import "@local/gribouille:0.0.0": *
// #set page(width: 18cm, height: 9.45cm, margin: 0cm)

// One row per song that entered the country top 30 between 2013 and 2019, with
// its writers and its producers. Both columns hold a comma-separated list, so
// they are split on the comma. The assertion below keeps that safe.
// Source: data/country_lyrics.csv (TidyTuesday 2026-08-25).
#let songs = csv("data/country_lyrics.csv", row-type: dictionary)

#let pct1 = format-percent(digits: 1)
#let comma = format-comma()

// The two credit columns, and the word the figure calls each one by.
#let roles = (
  (key: "writers", name: "Writers"),
  (key: "producer", name: "Producers"),
)
#let role-order = roles.map(r => r.name)

#let names-in(row, key) = {
  row
    .at(key)
    .split(",")
    .map(s => s.trim())
    .filter(s => s != "" and s != "NA")
}

// One row per credit: the chair and the person in it. A name credited twice on
// one song appears once, so a row means "this person is on this hit".
#let credit-rows = {
  let out = ()
  for role in roles {
    for song in songs {
      for person in names-in(song, role.key).dedup() {
        out.push((role: role.name, person: person))
      }
    }
  }
  out
}

// How many hits each name is on, most first. Ties break by name, so every render
// gives the same order.
#let credits = {
  count(credit-rows, "role", "person").sorted(key: c => (-c.n, c.person))
}
#let credits-for(role) = credits.filter(c => c.role == role)
#let credits-of(role, person) = {
  let hit = credits.find(c => c.role == role and c.person == person)
  if hit == none { 0 } else { hit.n }
}

// How much of the chart a club of a given size covers. For each song, take the
// best rank among its names, then count the songs that rank has reached. One
// pass builds the whole curve.
#let coverage(key, role) = {
  let order = credits-for(role).map(c => c.person)
  let rank-of = (:)
  for (i, n) in order.enumerate() { rank-of.insert(n, i + 1) }

  let reached = (:)
  let uncredited = 0
  for row in songs {
    let ranks = names-in(row, key).map(n => rank-of.at(n))
    if ranks.len() == 0 {
      uncredited += 1
      continue
    }
    let best = ranks.fold(ranks.first(), calc.min)
    reached.insert(str(best), reached.at(str(best), default: 0) + 1)
  }

  let curve = ()
  let running = 0
  for k in range(1, order.len() + 1) {
    running += reached.at(str(k), default: 0)
    curve.push((role: role, club: k, covered: running / songs.len()))
  }
  (curve: curve, uncredited: uncredited, club-size: order.len())
}

#let covered = roles.map(r => (name: r.name, ..coverage(r.key, r.name)))
#let cover-for(role) = covered.find(c => c.name == role)
#let covered-at(role, k) = cover-for(role).curve.at(k - 1).covered

#let curves = covered.map(c => c.curve).flatten()

// A comma inside a name would cut a person in half. One-word names are real
// here (busbee, Hardy, RedOne), so this looks for the fragments a bad split
// leaves: an initial, a suffix, or an empty string.
#for c in credits {
  assert(
    c.person.len() > 2 and c.person not in ("Jr.", "Sr.", "II", "III"),
    message: "a credit split into the fragment: " + c.person,
  )
}

// The two club sizes the figure names, and the claim: at the same size, the
// producers cover far more of the chart than the writers.
#let small-club = 10
#let large-club = 50
#assert(
  covered-at("Producers", small-club) > covered-at("Writers", small-club) + 0.1,
  message: "the producers' club no longer outreaches the writers' one",
)

// The right panel draws everyone with enough credits in either chair. Below
// five, the panel is a cloud of ones and twos that says nothing.
#let credit-floor = 5
#let people = {
  credits
    .map(c => c.person)
    .dedup()
    .map(person => (
      person: person,
      wrote: credits-of("Writers", person),
      produced: credits-of("Producers", person),
    ))
    .filter(p => p.wrote + p.produced >= credit-floor)
    .sorted(key: p => -(p.wrote + p.produced))
}
#let both-chairs = people.filter(p => p.wrote > 0 and p.produced > 0).len()

#let person-at(name) = {
  let hit = people.find(p => p.person == name)
  assert(hit != none, message: "no credits left for " + name)
  hit
}

// Ink, paper and rules come from the theme that typst-render resolved, so they
// follow the light and dark toggle of the site.
#let ink = theme-minimal().at("ink", default: black)
#let paper-colour = theme-minimal().at("paper", default: white)
#let rule-colour = ink.transparentize(30%)
#let note-colour = ink.transparentize(20%)

// A grotesque for the headings and a text face for the prose. Both are vendored
// in assets/fonts, so CI renders them too.
#let body-font = "Lato"
#let chart-font = "Archivo"

// Amber against blue is the strongest pair on both surfaces: a worst-case
// colour-vision distance of 23.2, and both clear the 3:1 contrast floor. Each
// curve is also named at its end.
#let role-colours = (
  "Writers": rgb("#c47a12"),
  "Producers": rgb("#2f7fc4"),
)
#let role-scale = scale-discrete(
  limits: role-order,
  palette: role-order.map(r => role-colours.at(r)),
)

#let note(body) = text(font: body-font, size: 6.5pt, fill: note-colour)[#body]
#let coloured(role) = box(text(fill: role-colours.at(role), weight: "bold")[#lower(role)])
#let tagged(role, body) = box(text(fill: role-colours.at(role), weight: "bold", size: 7pt)[#body])

// A label chip. The paper behind it lifts the text off what it sits on, and the
// border takes the colour of what the label names.
#let chip(body, border: note-colour, width: auto) = box(
  fill: paper-colour,
  inset: (x: 4pt, y: 3pt),
  radius: 2pt,
  stroke: 0.5pt + border.transparentize(40%),
  width: width,
)[#body]

#let role-chip(role) = chip(
  border: role-colours.at(role),
  text(font: body-font, size: 7.5pt, fill: role-colours.at(role), weight: "bold")[#role],
)

// The names the right panel calls out. `person-at` asserts each one still
// carries credits, so a name that leaves the data fails the render.
// The offsets point at the middle of the panel, in credits, so no label reaches
// for an edge and the panel needs no room made for it.
#let labelled = (
  ("Dann Huff", 9, -7),
  ("Scott Hendricks", 10, -5),
  ("Ross Copperman", -7, 8),
  ("Shane McAnally", -8, -6),
  ("Ashley Gorley", -9, 6),
).map(((person, dx, dy)) => (..person-at(person), nudge-x: dx, nudge-y: dy))

#let panel-theme = theme-minimal(
  legend-background: element-rect(fill: paper-colour),
  axis-title: element-text(font: body-font, size: 8pt),
  axis-text: element-text(font: body-font, size: 7pt),
  legend-text: element-text(font: body-font, size: 7pt),
  axis-ticks: element-tick(length: 0.05cm),
  // No one reads a fraction of a rank or a credit, so the minor rules do no work.
  panel-grid-minor: element-blank(),
)

// Left panel: how much of the chart the most-credited people cover, club size by
// club size. The axis is logarithmic because the shape is in the first dozen
// names, and a linear axis would spend its width on the tail.
#let coverage-panel = defer(
  plot,
  data: curves,
  mapping: aes(x: "club", y: "covered", colour: "role"),
  layers: (
    geom-vline(
      xintercept: small-club,
      colour: rule-colour,
      stroke: 0.7pt,
      linetype: "dashed",
    ),
    geom-step(stroke: 1.4pt),
    // The gap the figure is about, measured at the rule and stated in the empty
    // top left corner.
    annotate(
      "segment",
      x: small-club,
      xend: small-club,
      y: covered-at("Writers", small-club),
      yend: covered-at("Producers", small-club),
      stroke: 0.8pt + note-colour,
      arrow: arrow(length: 4pt, ends: "both"),
      clip: false,
    ),
    annotate(
      "typst",
      x: 1.05,
      y: 0.85,
      // A fixed width wraps the text onto four lines, clear of the curve.
      label: chip(width: 2.65cm, note[
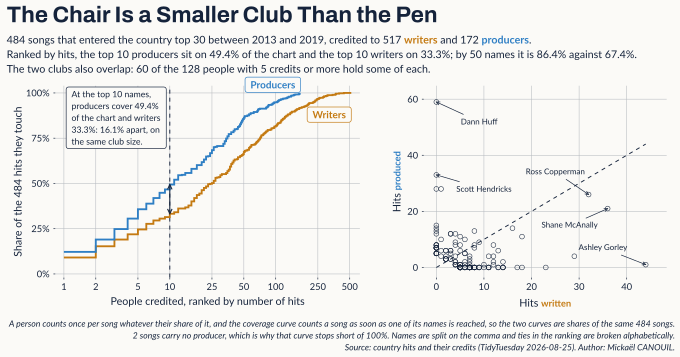
        At the top #small-club names, #lower(role-order.last()) cover #pct1(covered-at("Producers", small-club)) of the chart and #lower(role-order.first()) #pct1(covered-at("Writers", small-club)): #pct1(covered-at("Producers", small-club) - covered-at("Writers", small-club)) apart, on the same club size.
      ]),
      anchor: "west",
      clip: false,
    ),
    annotate(
      "typst",
      x: cover-for("Producers").club-size,
      y: 1.045,
      label: role-chip("Producers"),
      anchor: "east",
      clip: false,
    ),
    annotate(
      "typst",
      x: cover-for("Writers").club-size,
      y: 0.88,
      label: role-chip("Writers"),
      anchor: "east",
      clip: false,
    ),
  ),
  scales: scales(
    // `scale-log10` takes no `expand`, so the transform goes on a continuous
    // scale, which does.
    x: scale-continuous(
      transform: "log10",
      breaks: (1, 2, 5, 10, 25, 50, 100, 250, 500),
      labels: comma,
      expand: (3%, 3%),
    ),
    y: scale-continuous(
      limits: (0, 1),
      breaks: (0, 0.25, 0.5, 0.75, 1),
      labels: format-percent(digits: 0),
      expand: (2%, 4%),
    ),
    colour: role-scale,
  ),
  guides: guides(default: none),
  labels: labels(
    x: "People credited, ranked by number of hits",
    y: "Share of the " + comma(songs.len()) + " hits they touch",
    colour: none,
  ),
  theme: panel-theme,
  width: 9.4cm,
  height: 7cm,
)

// Right panel: the two clubs are not separate clubs. Everyone with five credits
// or more, placed by how many they hold in each chair. The diagonal is where
// the two counts match.
#let people-panel = defer(
  plot,
  data: people,
  mapping: aes(x: "wrote", y: "produced"),
  layers: (
    geom-abline(
      slope: 1,
      intercept: 0,
      colour: rule-colour,
      stroke: 0.7pt,
      linetype: "dashed",
    ),
    geom-point(size: 1.8pt, alpha: 0.6, colour: ink.transparentize(25%), stroke: 0.4pt),
    // The offsets use the `nudge-x` and `nudge-y` aesthetics, not `repel`. The
    // force layout works from the anchors alone and takes no direction, so off
    // an edge point it pushes outwards. The geom still draws the connector.
    geom-text(
      data: labelled,
      mapping: aes(
        x: "wrote",
        y: "produced",
        label: "person",
        nudge-x: "nudge-x",
        nudge-y: "nudge-y",
      ),
      size: 6pt,
      font: body-font,
      colour: note-colour,
      segment: true,
      segment-stroke: 0.5pt,
      arrow: arrow(length: 3pt),
      box-padding: 0.12,
      min-segment-length: 0.02,
    ),
  ),
  scales: scales(
    x: scale-continuous(breaks: (0, 10, 20, 30, 40), expand: (6%, 10%)),
    y: scale-continuous(breaks: (0, 20, 40, 60), expand: (6%, 8%)),
  ),
  guides: guides(default: none),
  labels: labels(
    x: typst[Hits #tagged("Writers", "written")],
    y: typst[Hits #tagged("Producers", "produced")],
  ),
  theme: panel-theme,
  width: 7.6cm,
  height: 7cm,
)

#compose(
  coverage-panel,
  people-panel,
  columns: 2,
  widths: (5, 4),
  gutter: 0.5cm,
  labels: labels(
    title: "The Chair Is a Smaller Club Than the Pen",
    subtitle: [
      #comma(songs.len()) songs that entered the country top 30 between 2013 and 2019, credited to #comma(credits-for("Writers").len()) #coloured("Writers") and #comma(credits-for("Producers").len()) #coloured("Producers"). \
      Ranked by hits, the top #small-club producers sit on #pct1(covered-at("Producers", small-club)) of the chart and the top #small-club writers on #pct1(covered-at("Writers", small-club))#[;] by #large-club names it is #pct1(covered-at("Producers", large-club)) against #pct1(covered-at("Writers", large-club)). \
      The two clubs also overlap: #both-chairs of the #people.len() people with #credit-floor credits or more hold some of each.
    ],
    caption: typst([
      A person counts once per song whatever their share of it, and the coverage curve counts a song as soon as one of its names is reached, so the two curves are shares of the same #comma(songs.len()) songs. \
      #cover-for("Producers").uncredited songs carry no producer, which is why that curve stops short of 100%. Names are split on the comma and ties in the ranking are broken alphabetically. \
      Source: country hits and their credits (TidyTuesday 2026-08-25). Author: #link("https://mickael.canouil.fr")[Mickaël CANOUIL].
    ]),
  ),
  theme: theme-minimal(
    plot-title: element-text(font: chart-font, size: 17pt, weight: "bold"),
    plot-subtitle: element-text(font: body-font, size: 8pt),
    plot-caption: element-text(font: body-font, size: 6.5pt),
  ),
  width: 18cm,
  height: 9.45cm,
)