Income statement
Revenue and costs for two years, with a subtotal for each section and an operating profit.
Finance
Amounts in pounds sterling grouped by section, with computed subtotals and a shaded operating profit row.
Annual accounts and management reports show results in this shape. Both tables below start from the same data dictionary.
The output
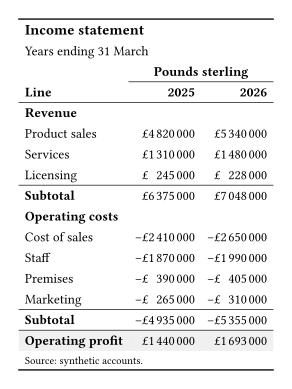
Keisen
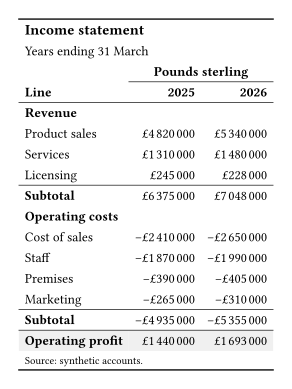
Native Typst
What Keisen does for you
- Writes each amount in pounds sterling, with grouped digits and its sign.
- Calculates a subtotal for each section.
- Calculates the operating profit from all the rows.
- Shades the profit row through
cells-grand-summary, so no cell gets its own fill.
The source
Keisen
// Gallery: income statement, built with Keisen.
// Its native twin is gallery-income-statement-native.typ; the two render alike.

#import "@preview/keisen:0.0.1": *

#set page(width: auto, height: auto, margin: 0.5cm)
#set text(font: "Libertinus Serif", size: 10pt)

#let data = (
  section: ("Revenue",) * 3 + ("Operating costs",) * 4,
  line: (
    "Product sales",
    "Services",
    "Licensing",
    "Cost of sales",
    "Staff",
    "Premises",
    "Marketing",
  ),
  fy2025: (4820000, 1310000, 245000, -2410000, -1870000, -390000, -265000),
  fy2026: (5340000, 1480000, 228000, -2650000, -1990000, -405000, -310000),
)

#display-table(
  data,
  table-header(title: [Income statement], subtitle: [Years ending 31 March]),
  table-stub(rowname: "line", group: "section", label: [Line]),
  columns-label(fy2025: [2025], fy2026: [2026]),
  table-spanner([Pounds sterling], ("fy2025", "fy2026")),
  format-currency(("fy2025", "fy2026"), currency: "GBP", decimals: 0),
  summary-rows(functions: (Subtotal: aggregate-sum), columns: (
    "fy2025",
    "fy2026",
  )),
  grand-summary-rows(functions: ("Operating profit": aggregate-sum), columns: (
    "fy2025",
    "fy2026",
  )),
  table-style(style(fill: luma(240)), locations: cells-grand-summary()),
  table-source-note([Source: synthetic accounts.]),
  theme: theme-booktabs(),
)
Native Typst
// Gallery: income statement, built in native Typst from the same data.
// Its Keisen twin is gallery-income-statement-keisen.typ; the two render alike.

#set page(width: auto, height: auto, margin: 0.5cm)
#set text(font: "Libertinus Serif", size: 10pt)

#let data = (
  section: ("Revenue",) * 3 + ("Operating costs",) * 4,
  line: (
    "Product sales",
    "Services",
    "Licensing",
    "Cost of sales",
    "Staff",
    "Premises",
    "Marketing",
  ),
  fy2025: (4820000, 1310000, 245000, -2410000, -1870000, -390000, -265000),
  fy2026: (5340000, 1480000, 228000, -2650000, -1990000, -405000, -310000),
)

#let grouped(number) = {
  let digits = str(calc.abs(number))
  let groups = ()
  while digits.len() > 3 {
    groups.insert(0, digits.slice(-3))
    digits = digits.slice(0, -3)
  }
  groups.insert(0, digits)
  (if number < 0 { "−" } else { "" }) + groups.join(sym.space.thin)
}

#let pounds(number) = {
  let amount = grouped(calc.abs(number))
  (if number < 0 { "−" } else { "" }) + "£" + amount
}

#let years = ("fy2025", "fy2026")
#let body = ()
#for section in ("Revenue", "Operating costs") {
  let rows = range(data.line.len()).filter(row => (
    data.section.at(row) == section
  ))
  body.push(table.cell(colspan: 3, strong(section)))
  for row in rows {
    body.push(data.line.at(row))
    body += years.map(year => pounds(data.at(year).at(row)))
  }
  body.push(table.hline(stroke: 0.5pt))
  body.push([*Subtotal*])
  body += years.map(year => pounds(
    rows.map(row => data.at(year).at(row)).sum(),
  ))
}

#table(
  columns: 3,
  align: (start, end, end),
  stroke: none,
  inset: 0.45em,
  table.hline(stroke: 1pt),
  table.cell(colspan: 3, align: start, text(
    size: 1.1em,
    weight: "bold",
  )[Income statement]),
  table.cell(colspan: 3, align: start)[Years ending 31 March],
  table.header(
    [],
    table.cell(colspan: 2, align: center)[*Pounds sterling*],
    table.hline(start: 1, stroke: 0.5pt),
    [*Line*], [*2025*], [*2026*],
    table.hline(stroke: 0.5pt),
  ),
  ..body,
  table.hline(stroke: 0.5pt),
  table.cell(fill: luma(240))[*Operating profit*],
  ..years.map(year => table.cell(fill: luma(240), pounds(data.at(year).sum()))),
  table.cell(colspan: 3, align: start, text(
    size: 0.8em,
  )[Source: synthetic accounts.]),
  table.hline(stroke: 1pt),
)