Laboratory assay
Measurements with their uncertainty, values below detection, and results over a limit.
Science
Values joined to their uncertainty, scientific notation for small values, a replacement for missing values, and results over a limit in red.
Laboratory reports and monitoring returns list their samples in this shape. Both tables below start from the same data dictionary.
The output
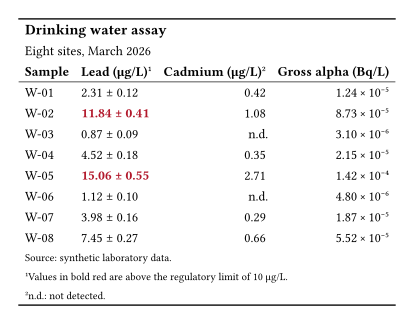
Keisen
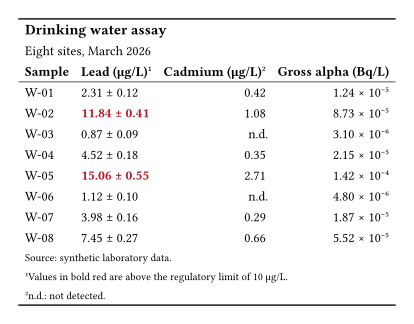
Native Typst
What Keisen does for you
- Joins each value to its uncertainty with one
columns-combine. - Writes the small activity values in scientific notation.
- Replaces each missing value with n.d. through one directive.
- Marks each result over the limit, chosen by a predicate on the data.
The source
Keisen
// Gallery: laboratory assay, built with Keisen.
// Its native twin is gallery-assay-native.typ; the two render alike.

#import "@preview/keisen:0.0.1": *

#set page(width: auto, height: auto, margin: 0.5cm)
#set text(font: "Libertinus Serif", size: 10pt)

#let data = (
  sample: ("W-01", "W-02", "W-03", "W-04", "W-05", "W-06", "W-07", "W-08"),
  lead: (2.31, 11.84, 0.87, 4.52, 15.06, 1.12, 3.98, 7.45),
  lead-error: (0.12, 0.41, 0.09, 0.18, 0.55, 0.10, 0.16, 0.27),
  cadmium: (0.42, 1.08, none, 0.35, 2.71, none, 0.29, 0.66),
  activity: (
    0.0000124,
    0.0000873,
    0.0000031,
    0.0000215,
    0.000142,
    0.0000048,
    0.0000187,
    0.0000552,
  ),
)

#display-table(
  data,
  table-header(
    title: [Drinking water assay],
    subtitle: [Eight sites, March 2026],
  ),
  table-stub(rowname: "sample", label: [Sample]),
  format-number(("lead", "lead-error", "cadmium"), decimals: 2),
  format-scientific("activity", decimals: 2),
  substitute-missing("cadmium", replacement: [n.d.]),
  columns-combine(
    "lead-result",
    ("lead", "lead-error"),
    (value, error) => [#value ± #error],
    label: [Lead (µg/L)],
  ),
  columns-label(cadmium: [Cadmium (µg/L)], activity: [Gross alpha (Bq/L)]),
  table-style(
    style(text: (fill: rgb("#b2182b"), weight: "bold")),
    locations: cells-body(columns: "lead-result", rows: row => row.lead > 10),
  ),
  table-footnote(
    [Values in bold red are above the regulatory limit of 10 µg/L.],
    locations: cells-column-labels(columns: "lead-result"),
  ),
  table-footnote(
    [n.d.: not detected.],
    locations: cells-column-labels(columns: "cadmium"),
  ),
  table-source-note([Source: synthetic laboratory data.]),
  theme: theme-booktabs(),
)
Native Typst
// Gallery: laboratory assay, built in native Typst from the same data.
// Its Keisen twin is gallery-assay-keisen.typ; the two render alike.

#set page(width: auto, height: auto, margin: 0.5cm)
#set text(font: "Libertinus Serif", size: 10pt)

#let data = (
  sample: ("W-01", "W-02", "W-03", "W-04", "W-05", "W-06", "W-07", "W-08"),
  lead: (2.31, 11.84, 0.87, 4.52, 15.06, 1.12, 3.98, 7.45),
  lead-error: (0.12, 0.41, 0.09, 0.18, 0.55, 0.10, 0.16, 0.27),
  cadmium: (0.42, 1.08, none, 0.35, 2.71, none, 0.29, 0.66),
  activity: (
    0.0000124,
    0.0000873,
    0.0000031,
    0.0000215,
    0.000142,
    0.0000048,
    0.0000187,
    0.0000552,
  ),
)

#let fixed(value, digits) = {
  let text = str(calc.round(value, digits: digits))
  let parts = text.split(".")
  let decimals = parts.at(1, default: "")
  parts.at(0) + "." + decimals + "0" * (digits - decimals.len())
}

#let scientific(value, digits) = {
  let exponent = calc.floor(calc.log(value))
  [#fixed(value / calc.pow(10, exponent), digits) × 10#super[#str(exponent).replace("-", "−")]]
}

#let body = ()
#for row in range(data.sample.len()) {
  let lead = (
    fixed(data.lead.at(row), 2) + " ± " + fixed(data.lead-error.at(row), 2)
  )
  let cadmium = data.cadmium.at(row)
  body += (
    data.sample.at(row),
    if data.lead.at(row) > 10 {
      text(fill: rgb("#b2182b"), weight: "bold", lead)
    } else { lead },
    if cadmium == none { [n.d.] } else { fixed(cadmium, 2) },
    scientific(data.activity.at(row), 2),
  )
}

#table(
  columns: 4,
  align: (start, start, end, end),
  stroke: none,
  inset: 0.45em,
  table.hline(stroke: 1pt),
  table.cell(colspan: 4, align: start, text(
    size: 1.1em,
    weight: "bold",
  )[Drinking water assay]),
  table.cell(colspan: 4, align: start)[Eight sites, March 2026],
  table.header(
    [*Sample*],
    [*Lead (µg/L)*#super[1]],
    [*Cadmium (µg/L)*#super[2]],
    [*Gross alpha (Bq/L)*],
    table.hline(stroke: 0.5pt),
  ),
  ..body,
  table.cell(colspan: 4, align: start, text(
    size: 0.8em,
  )[Source: synthetic laboratory data.]),
  table.cell(colspan: 4, align: start, text(
    size: 0.8em,
  )[#super[1]Values in bold red are above the regulatory limit of 10 µg/L.]),
  table.cell(colspan: 4, align: start, text(
    size: 0.8em,
  )[#super[2]n.d.: not detected.]),
  table.hline(stroke: 1pt),
)