Regression results
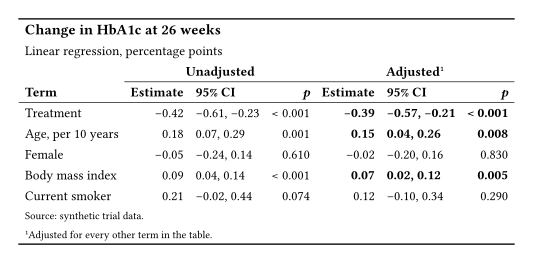
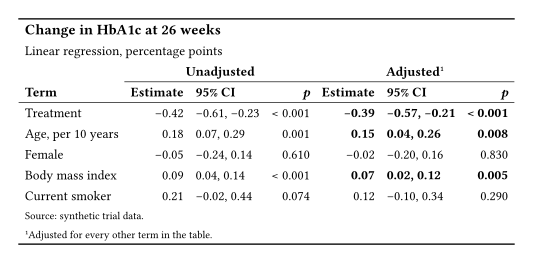
Two models side by side, each estimate with its confidence interval and its p-value.
Statistics
Unadjusted and adjusted estimates under one spanner each, with small p-values written as less than 0.001 and significant results in bold.
Results sections and supplementary tables show regression models in this shape. Both tables below start from the same data dictionary.
The output
Keisen
Native Typst
What Keisen does for you
- Rounds the estimates and the interval bounds to two decimal places.
- Writes a p-value below 0.001 as
< 0.001through one directive for each column, chosen by a predicate on the rows. - Sets the significant adjusted results in bold from one predicate on the data, so no cell is wrapped by hand.
- Puts one spanner over the three columns of each model.
The source
Keisen
// Gallery: regression results, built with Keisen.
// Its native twin is gallery-regression-native.typ; the two render alike.

#import "@preview/keisen:0.0.1": *

#set page(width: auto, height: auto, margin: 0.5cm)
#set text(font: "Libertinus Serif", size: 10pt)

#let data = (
  term: (
    "Treatment",
    "Age, per 10 years",
    "Female",
    "Body mass index",
    "Current smoker",
  ),
  crude: (-0.42, 0.18, -0.05, 0.09, 0.21),
  crude-lower: (-0.61, 0.07, -0.24, 0.04, -0.02),
  crude-upper: (-0.23, 0.29, 0.14, 0.14, 0.44),
  crude-p: (0.000021, 0.0012, 0.61, 0.00034, 0.074),
  adjusted: (-0.39, 0.15, -0.02, 0.07, 0.12),
  adjusted-lower: (-0.57, 0.04, -0.20, 0.02, -0.10),
  adjusted-upper: (-0.21, 0.26, 0.16, 0.12, 0.34),
  adjusted-p: (0.000038, 0.0081, 0.83, 0.0049, 0.29),
)

#display-table(
  data,
  table-header(
    title: [Change in HbA1c at 26 weeks],
    subtitle: [Linear regression, percentage points],
  ),
  table-stub(rowname: "term", label: [Term]),
  format-number(
    name => name != "term" and not name.ends-with("-p"),
    decimals: 2,
  ),
  format-number(name => name.ends-with("-p"), decimals: 3),
  format("crude-p", value => [< 0.001], rows: row => row.crude-p < 0.001),
  format("adjusted-p", value => [< 0.001], rows: row => row.adjusted-p < 0.001),
  columns-combine(
    "crude-interval",
    ("crude-lower", "crude-upper"),
    (low, high) => [#low, #high],
    label: [95% CI],
  ),
  columns-combine(
    "adjusted-interval",
    ("adjusted-lower", "adjusted-upper"),
    (low, high) => [#low, #high],
    label: [95% CI],
  ),
  columns-label(
    crude: [Estimate],
    crude-p: [_p_],
    adjusted: [Estimate],
    adjusted-p: [_p_],
  ),
  table-spanner([Unadjusted], ("crude", "crude-interval", "crude-p")),
  table-spanner([Adjusted], ("adjusted", "adjusted-interval", "adjusted-p")),
  table-style(
    style(text: (weight: "bold")),
    locations: cells-body(
      columns: ("adjusted", "adjusted-interval", "adjusted-p"),
      rows: row => row.adjusted-p < 0.05,
    ),
  ),
  table-footnote(
    [Adjusted for every other term in the table.],
    locations: cells-column-spanners(spanners: [Adjusted]),
  ),
  table-source-note([Source: synthetic trial data.]),
  theme: theme-booktabs(),
)
Native Typst
// Gallery: regression results, built in native Typst from the same data.
// Its Keisen twin is gallery-regression-keisen.typ; the two render alike.

#set page(width: auto, height: auto, margin: 0.5cm)
#set text(font: "Libertinus Serif", size: 10pt)

#let data = (
  term: (
    "Treatment",
    "Age, per 10 years",
    "Female",
    "Body mass index",
    "Current smoker",
  ),
  crude: (-0.42, 0.18, -0.05, 0.09, 0.21),
  crude-lower: (-0.61, 0.07, -0.24, 0.04, -0.02),
  crude-upper: (-0.23, 0.29, 0.14, 0.14, 0.44),
  crude-p: (0.000021, 0.0012, 0.61, 0.00034, 0.074),
  adjusted: (-0.39, 0.15, -0.02, 0.07, 0.12),
  adjusted-lower: (-0.57, 0.04, -0.20, 0.02, -0.10),
  adjusted-upper: (-0.21, 0.26, 0.16, 0.12, 0.34),
  adjusted-p: (0.000038, 0.0081, 0.83, 0.0049, 0.29),
)

#let fixed(value, digits) = {
  let text = str(calc.round(value, digits: digits))
  let parts = text.split(".")
  let decimals = parts.at(1, default: "")
  parts.at(0) + "." + decimals + "0" * (digits - decimals.len())
}

#let p-value(p) = if p < 0.001 { [< 0.001] } else { fixed(p, 3) }

#let body = ()
#for row in range(data.term.len()) {
  body.push(data.term.at(row))
  for model in ("crude", "adjusted") {
    let cells = (
      fixed(data.at(model).at(row), 2),
      fixed(data.at(model + "-lower").at(row), 2)
        + ", "
        + fixed(data.at(model + "-upper").at(row), 2),
      p-value(data.at(model + "-p").at(row)),
    )
    if model == "adjusted" and data.adjusted-p.at(row) < 0.05 {
      cells = cells.map(cell => strong(cell))
    }
    body += cells
  }
}

#table(
  columns: 7,
  align: (start, end, start, end, end, start, end),
  stroke: none,
  inset: 0.45em,
  table.hline(stroke: 1pt),
  table.cell(colspan: 7, align: start, text(
    size: 1.1em,
    weight: "bold",
  )[Change in HbA1c at 26 weeks]),
  table.cell(colspan: 7, align: start)[Linear regression, percentage points],
  table.header(
    [],
    table.cell(colspan: 3, align: center)[*Unadjusted*],
    table.cell(colspan: 3, align: center)[*Adjusted*#super[1]],
    table.hline(start: 1, end: 4, stroke: 0.5pt),
    table.hline(start: 4, stroke: 0.5pt),
    [*Term*],
    [*Estimate*],
    [*95% CI*],
    [*_p_*],
    [*Estimate*],
    [*95% CI*],
    [*_p_*],
    table.hline(stroke: 0.5pt),
  ),
  ..body,
  table.cell(colspan: 7, align: start, text(
    size: 0.8em,
  )[Source: synthetic trial data.]),
  table.cell(colspan: 7, align: start, text(
    size: 0.8em,
  )[#super[1]Adjusted for every other term in the table.]),
  table.hline(stroke: 1pt),
)