Accessibility
Alt text, tagged PDF, and colour choices for Gribouille plots.
A Gribouille plot is an image. Assistive technology, tagged-PDF readers, and search indexes need a text alternative for it. Colour-coded marks also need a fallback for readers who cannot tell the colours apart or who print in black and white. This page covers the two things you control: the alt text on a plot, and the colour and shape channels it uses. Both apply whether you embed plots in a Quarto document or compile Typst yourself. Each workflow sets the alt text in a different place, so read the matching section.
Alt text on a plot
Every plot call accepts an alt: parameter: the text alternative a screen reader announces in place of the figure. Keep it to one or two short sentences. Describe the takeaway rather than naming the axes, and do not repeat the visible title word for word. The visible labels (title, subtitle, caption, axis and legend titles) belong on labels. The alt: parameter is the non-visible description, not a substitute for a caption.
#plot(
  data: penguins,
  mapping: aes(x: "flipper-len", y: "body-mass", colour: "species"),
  layers: (geom-point(size: 2pt),),
  labels: labels(
    title: "Penguin body mass vs. flipper length",
    x: "Flipper length (mm)",
    y: "Body mass (g)",
    colour: "Species",
  ),
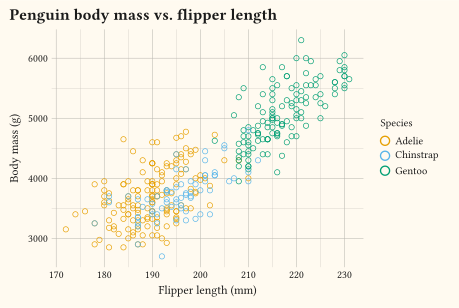
  alt: "Body mass rises with flipper length for all three penguin species; Gentoo are the heaviest and have the longest flippers.",
)- Embedding a plot in a Quarto document through the
typst-renderextension: setalton the code block, not onplot(). See Plots in Quarto. - Compiling a Typst document yourself to PDF: set
alt:on theplot()call. See Tagged PDF from Typst.
Plots in Quarto
The typst-render extension compiles each {typst} block to a standalone image before it reaches the page. The reader therefore gets an <img> (HTML output) or an embedded image() call (Typst output), never your source. The alt text the reader hears must come from the code block, not from plot(alt: …). An SVG carries no PDF structure tags, so the extension discards a figure(alt: …) inside the block along with the rest of the source. Set it with the alt cell option. For a numbered, cross-referenceable figure, pair it with cap and label: fig-…:
```{typst}
//| label: fig-penguins
//| cap: "Penguin body mass against flipper length, coloured by species."
//| alt: "Body mass rises with flipper length for all three penguin species."
//| output-filename: "/assets/typst-render/my-page/penguins.svg"
#import "@preview/gribouille:0.7.0": *
#plot(
  data: penguins,
  mapping: aes(x: "flipper-len", y: "body-mass", colour: "species"),
  layers: (geom-point(size: 2pt),),
)
```
alt becomes the alt attribute on the rendered <img> in HTML, and the alt argument of image() in Quarto Typst output. The description therefore survives in every format. output-filename follows this project’s convention of a leading /, resolved against the Quarto project root. In your own project, use the path your _quarto.yml expects. If you also compile the same .typ file directly, as in the next section, keep a plot(alt: …) inside the block. Through typst-render it has no effect. The Get Started tutorial sets alt on every example block, so each step is a worked example of this pattern.
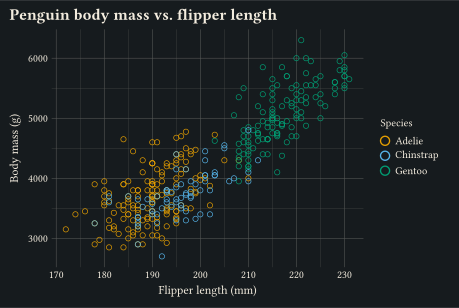
For example, this page renders a penguins plot through typst-render like so:
Tagged PDF from Typst
When you compile a Typst document, Typst writes a tagged PDF by default, even without a standard flag. Without alt:, every piece of the plot’s text lands in the reading order as one flat run. That text includes each axis tick value, the axis names, the legend title, and the legend keys. A screen reader reads something like Flipper length (mm) Body mass (g) 170 180 190 200 210 220 230 3000 4000 5000 6000 Species Adelie Chinstrap Gentoo with no structure and no meaning.
Setting alt: on the plot() call fixes that. The plot becomes a figure whose PDF structure node carries your sentence. Gribouille also marks the plot’s text labels as PDF artifacts, so a screen reader skips them. Two lines at the top of the document turn the example above into a complete, PDF/UA-1-ready file:
#import "@preview/gribouille:0.7.0": *
#set document(title: "Penguin body mass")
Then compile it:
typst compile plot.typ plot.pdf --pdf-standard ua-1--pdf-standard ua-1 checks the document against PDF/UA-1, which requires the document title above, among other things. A plain typst compile plot.typ plot.pdf still produces a tagged PDF, but without the conformance check. To confirm the result, run pdfinfo -struct-text plot.pdf. The output must show a single Figure ["…your alt text…"] node under Document, with no stray tick or legend text beside it.
Colour and redundant encoding
Gribouille’s default discrete colour scale is the Okabe-Ito palette (Wong 2011), chosen to stay distinguishable for the common forms of colour-vision deficiency. A plain aes(colour: …) therefore already starts on safe ground. Colour still fails, though, whenever colour is removed: greyscale print, photocopies, some projectors. Two things help.
- Continuous data:
scale-viridis-c(and the binnedscale-viridis-b) is perceptually uniform and increases monotonically in lightness, so it survives greyscale. Usescale-viridis-dfor the discrete version. - Other discrete palettes:
scale-brewerexposes the ColorBrewer families. Turn on the “colour-blind safe” filter on colorbrewer2.org to pick one. Avoidscale-huefor categorical data unless you have a specific reason, as it is not colour-blind safe.
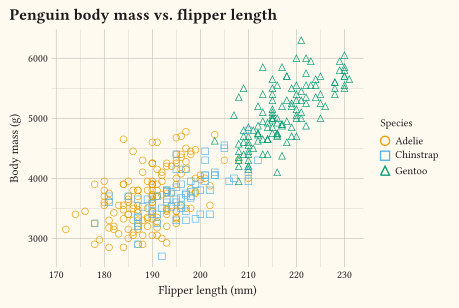
When a figure must read in black and white, the reliable fix is a second, non-colour channel. Map the grouping variable to shape: and/or linetype: as well as colour:, controlled by scale-discrete and scale-discrete. Shape and linetype only stay legible for low-cardinality factors, roughly six levels or fewer.
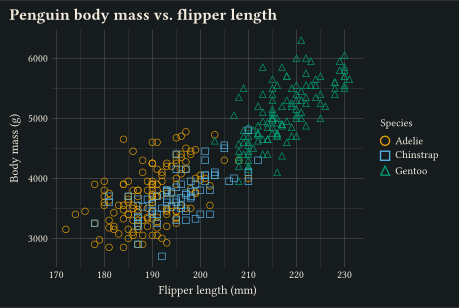
In the example below, the colours are still the default Okabe-Ito. The mapping also sends species to point shape, so the three groups remain separable with no colour at all.
#plot(
  data: penguins,
  mapping: aes(
    x: "flipper-len",
    y: "body-mass",
    colour: "species",
    shape: "species",
  ),
  layers: (geom-point(size: 2.5pt),),
  labels: labels(
    title: "Penguin body mass vs. flipper length",
    x: "Flipper length (mm)",
    y: "Body mass (g)",
    colour: "Species",
    shape: "Species",
  ),
  width: 12cm,
  height: 8cm,
)
See also
get-alt-textreads the alt text back off a plot spec. This is useful if you generate plots programmatically and want their descriptions in a manifest or index.