Examples
One page per thing a reader is trying to do.
Every table in this section is compiled, when the site is built, from the file in the repository’s tests/visual/ directory that the page shows. The listings are those files as they are, except that the site writes their /lib.typ import as the package import a reader writes. tools/check.sh compiles them on every run, and tools/dry-release.sh compiles them against an installed copy of the package.
A table, built and formatted
The smallest thing worth calling a display table: a title, labelled columns, formatted numbers, and a source note.
// A title, a subtitle, column labels, formatted numbers and a source note.

#import "@preview/keisen:0.0.1": *

#set page(width: auto, height: auto, margin: 0.5cm)
#set text(font: "Libertinus Serif", size: 10pt)

#display-table(
  (
    model: ("Audi A4", "BMW 320i", "Volkswagen Golf"),
    consumption: (7.25, 8.5, 6.125),
    year: (2019, 2021, 2020),
  ),
  table-header(
    title: [Fuel consumption],
    subtitle: [Litres per 100 kilometres],
  ),
  columns-label(
    model: [Model],
    consumption: [Consumption],
    year: [Year],
  ),
  format-number("consumption", decimals: 2),
  format-integer("year", grouping: none),
  table-source-note([Source: manufacturer figures.]),
)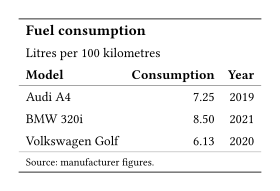
Numeric columns align themselves against the end edge and the others against the start edge, so nothing needed saying about alignment. 6.125 rounds to 6.13: the default is half-up, computed in decimal arithmetic rather than in floats.
That is the shape of every table below. Data goes in first, directives follow in the order they should apply, and the theme is an argument like any other.
Find your case
- Total a table by group, with a subtotal closing each block and a grand total closing the table.
- Draw attention to a total, by shading a subtotal row and marking it with a note.
- Group rows the data does not group, when no column says which rows belong together.
- Report an estimate with its error, reading two columns as one.
- Write values in their own notation: money, magnitudes, sizes, dates, and markup.
- Write numbers the local way, setting the separators once for the whole table.
- Mark a cell that fails a threshold, styled by what the data says rather than by where the cell sits.
- Carry a table across pages, with the labels and the group reprinted overleaf.
- Show a trend inside a cell, on one scale down the column.
- Set a plot in a sentence, at the height of the text around it.
- Set a table right to left, mirrored with the writing direction.