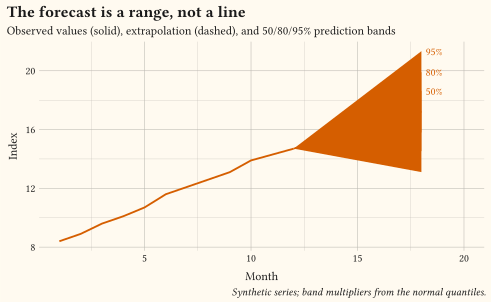
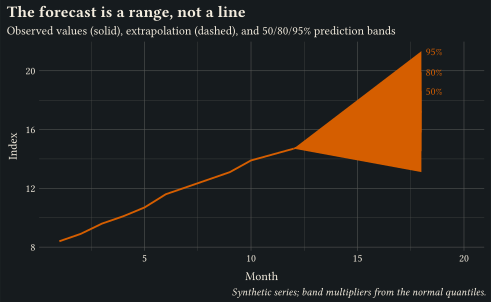
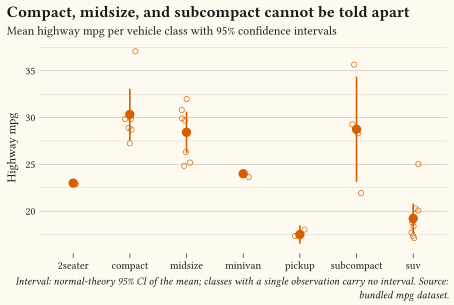
// Showcase: fan chart with graded 50/80/95% ribbons around a forecast;
// each band is labelled in-plot so the reader knows what the shading means.

#import "@preview/gribouille:0.7.0": *

#set page(width: auto, height: auto, margin: 0cm)

#let accent = okabe-ito.at(5)

// Twelve observed months, then a six-month linear extrapolation whose
// uncertainty widens with the horizon.
#let observed = (
  (8.4, 8.9, 9.6, 10.1, 10.7, 11.6, 12.1, 12.6, 13.1, 13.9, 14.3, 14.7)
    .enumerate()
    .map(pair => (month: pair.at(0) + 1, value: pair.at(1)))
)

// Two-sided band multipliers, derived rather than pasted: a 50% band spans
// the central half of the normal, so its edge is the 75th percentile.
#let z50 = qnorm(0.75)
#let z80 = qnorm(0.90)
#let z95 = qnorm(0.975)

#let last = observed.last()
#let slope = 0.42
#let forecast = range(0, 7).map(step => {
  let spread = 0.35 * step
  let fit = last.value + slope * step
  (
    month: last.month + step,
    fit: fit,
    lo50: fit - z50 * spread,
    hi50: fit + z50 * spread,
    lo80: fit - z80 * spread,
    hi80: fit + z80 * spread,
    lo95: fit - z95 * spread,
    hi95: fit + z95 * spread,
  )
})

#plot(
  data: observed,
  mapping: aes(x: "month", y: "value"),
  layers: (
    geom-ribbon(
      inherit-aes: false,
      data: forecast,
      mapping: aes(x: "month", ymin: "lo95", ymax: "hi95"),
      fill: accent,
      alpha: 0.15,
    ),
    geom-ribbon(
      inherit-aes: false,
      data: forecast,
      mapping: aes(x: "month", ymin: "lo80", ymax: "hi80"),
      fill: accent,
      alpha: 0.25,
    ),
    geom-ribbon(
      inherit-aes: false,
      data: forecast,
      mapping: aes(x: "month", ymin: "lo50", ymax: "hi50"),
      fill: accent,
      alpha: 0.4,
    ),
    geom-line(stroke: 1.4pt, colour: accent),
    geom-line(
      inherit-aes: false,
      data: forecast,
      mapping: aes(x: "month", y: "fit"),
      stroke: 1.2pt,
      colour: accent,
      linetype: (4pt, 3pt),
    ),
    annotate(
      "text",
      x: 18.2,
      y: 18.6,
      label: "50%",
      size: 8pt,
      anchor: "west",
      colour: accent,
    ),
    annotate(
      "text",
      x: 18.2,
      y: 19.9,
      label: "80%",
      size: 8pt,
      anchor: "west",
      colour: accent,
    ),
    annotate(
      "text",
      x: 18.2,
      y: 21.3,
      label: "95%",
      size: 8pt,
      anchor: "west",
      colour: accent,
    ),
  ),
  scales: scales(x: scale-continuous(limits: (1, 20))),
  labels: labels(
    title: "The forecast is a range, not a line",
    subtitle: "Observed values (solid), extrapolation (dashed), and 50/80/95% prediction bands",
    x: "Month",
    y: "Index",
    caption: "Synthetic series; band multipliers from the normal quantiles.",
  ),
  theme: theme-minimal(),
  width: 13cm,
  height: 8cm,
)