Rotating axis tick labels
one categorical
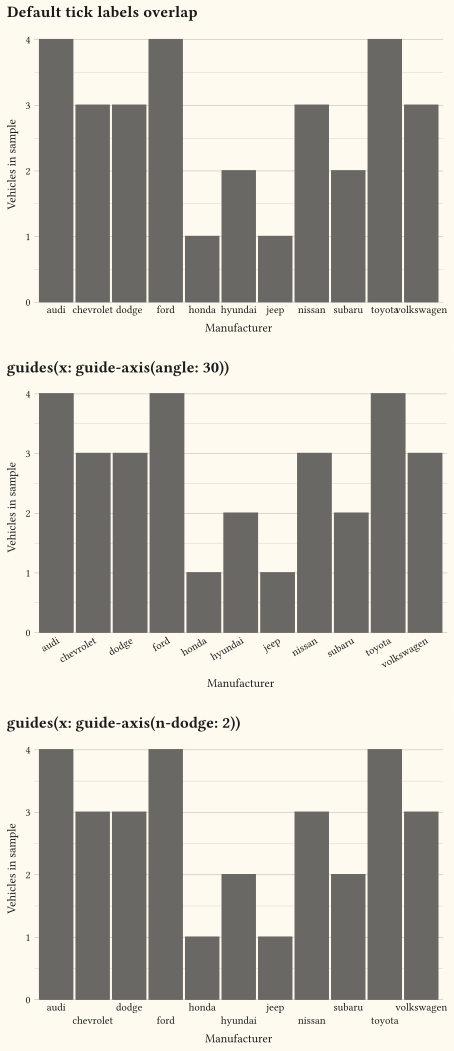
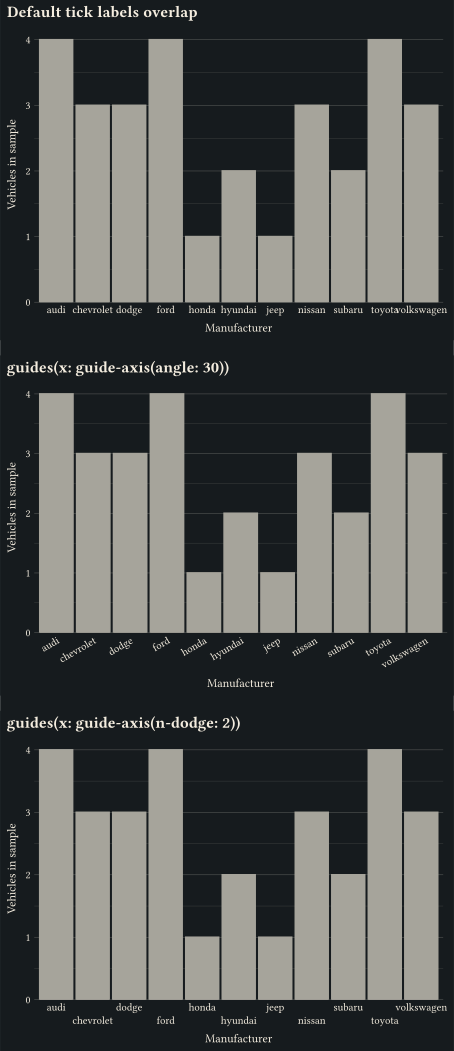
guide-axis rotates or dodges discrete tick labels so long category names stay readable.
Control tick labels, axis transforms, and legend layout.
Guides translate scales back into something a reader can decode: axes, legends, and colourbars. These examples rotate and dodge crowded tick labels, add log-scale minor ticks and secondary axes, and control legend order, alignment, and placement down to an arbitrary canvas offset. A guide earns its space only when the reader needs it; drop the legend entirely once series are labelled directly. Every example ships its full source: click View source to copy it.
one categorical
guide-axis rotates or dodges discrete tick labels so long category names stay readable.
two numerics
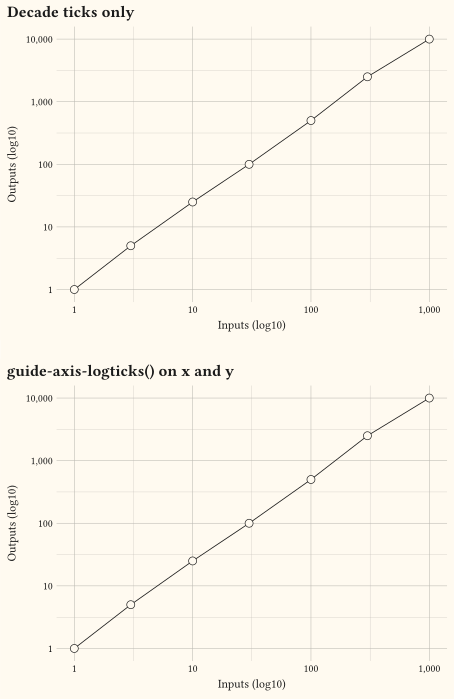
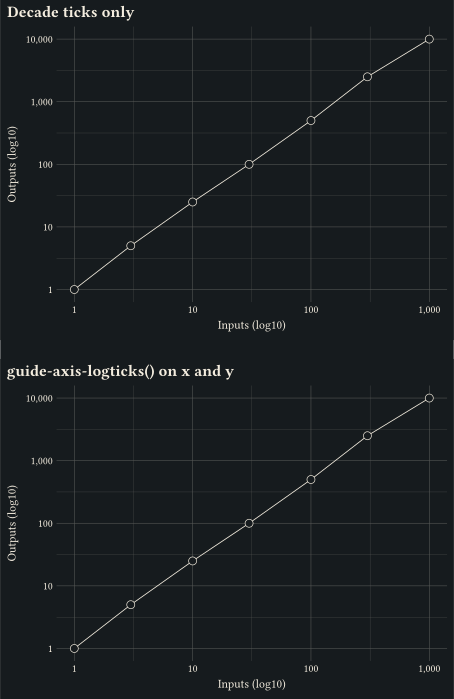
guide-axis-logticks draws minor ticks at log-scale subdivisions on a log10-transformed axis.
two numerics
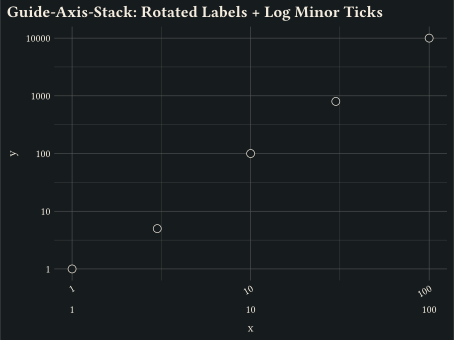
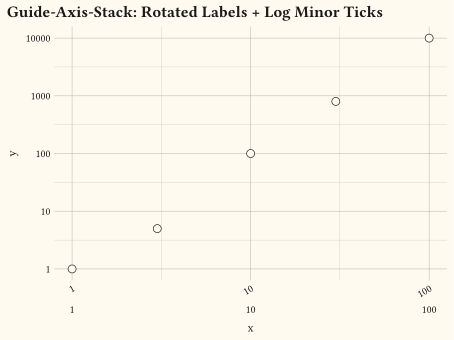
Stack a rotated guide-axis over a guide-axis-logticks pass via guide-axis-stack on the same x axis.
any
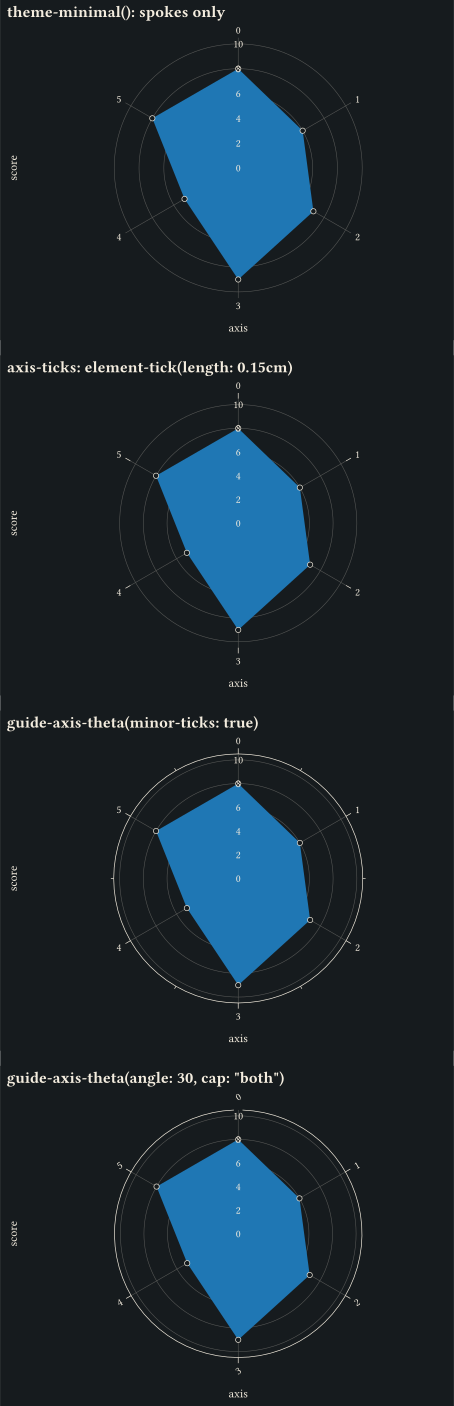
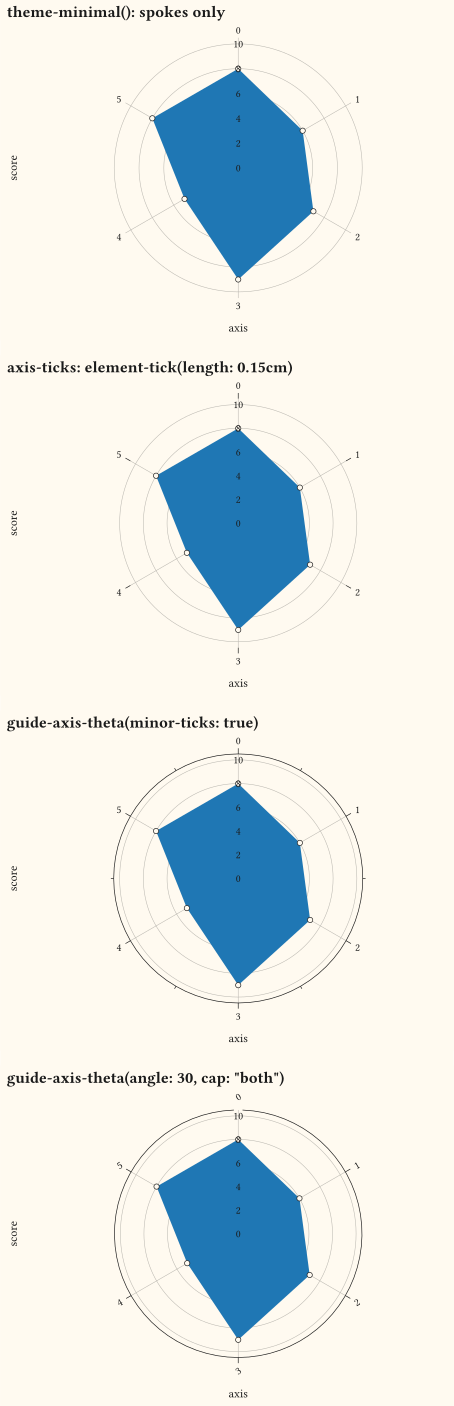
guide-axis-theta rotates radial tick labels, emits half-step minor ticks, and draws an outer axis arc with optional cap.
any
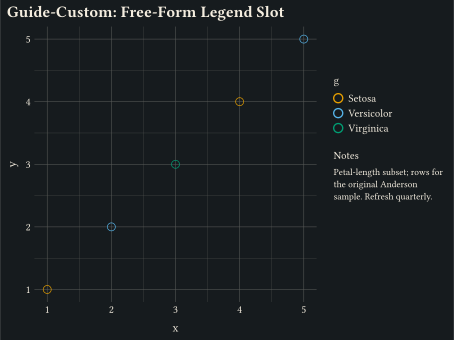
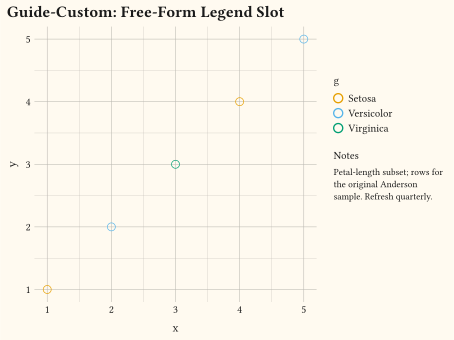
guide-custom drops arbitrary Typst content into the legend area alongside the auto-built colour swatch.
any
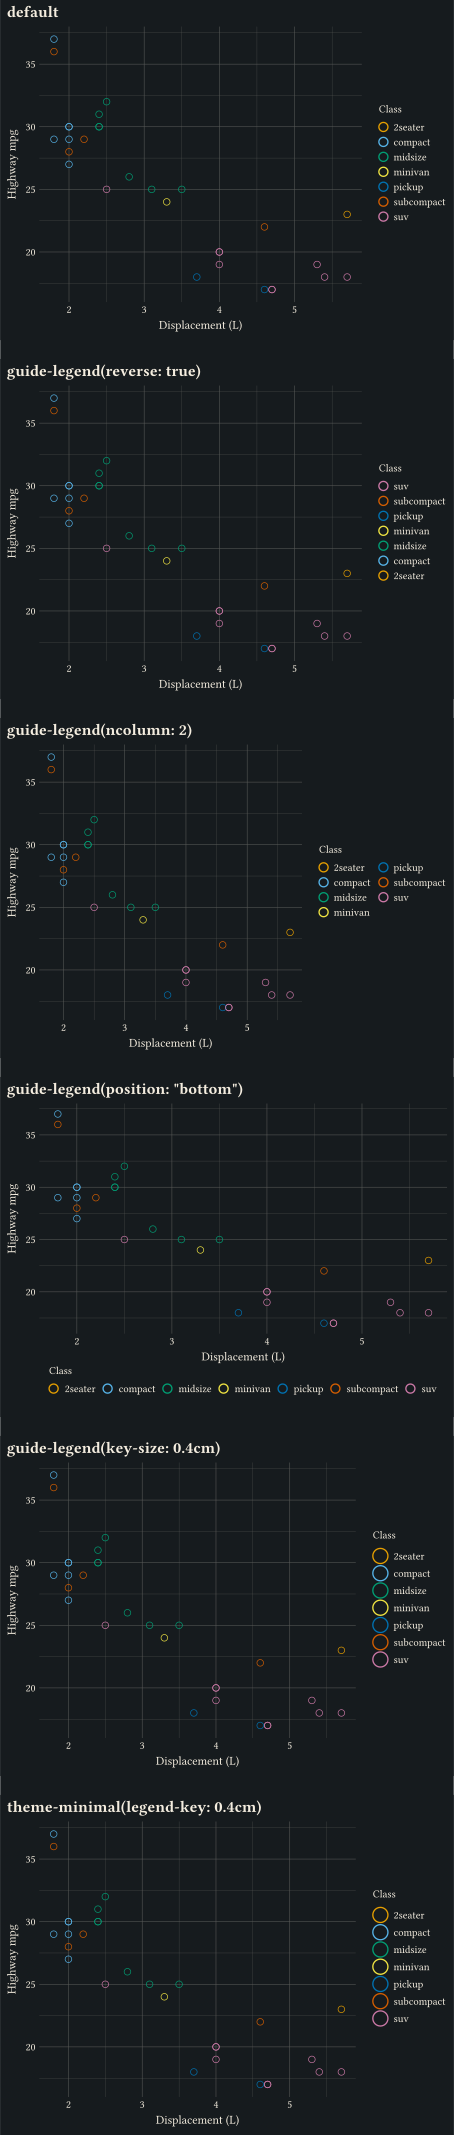
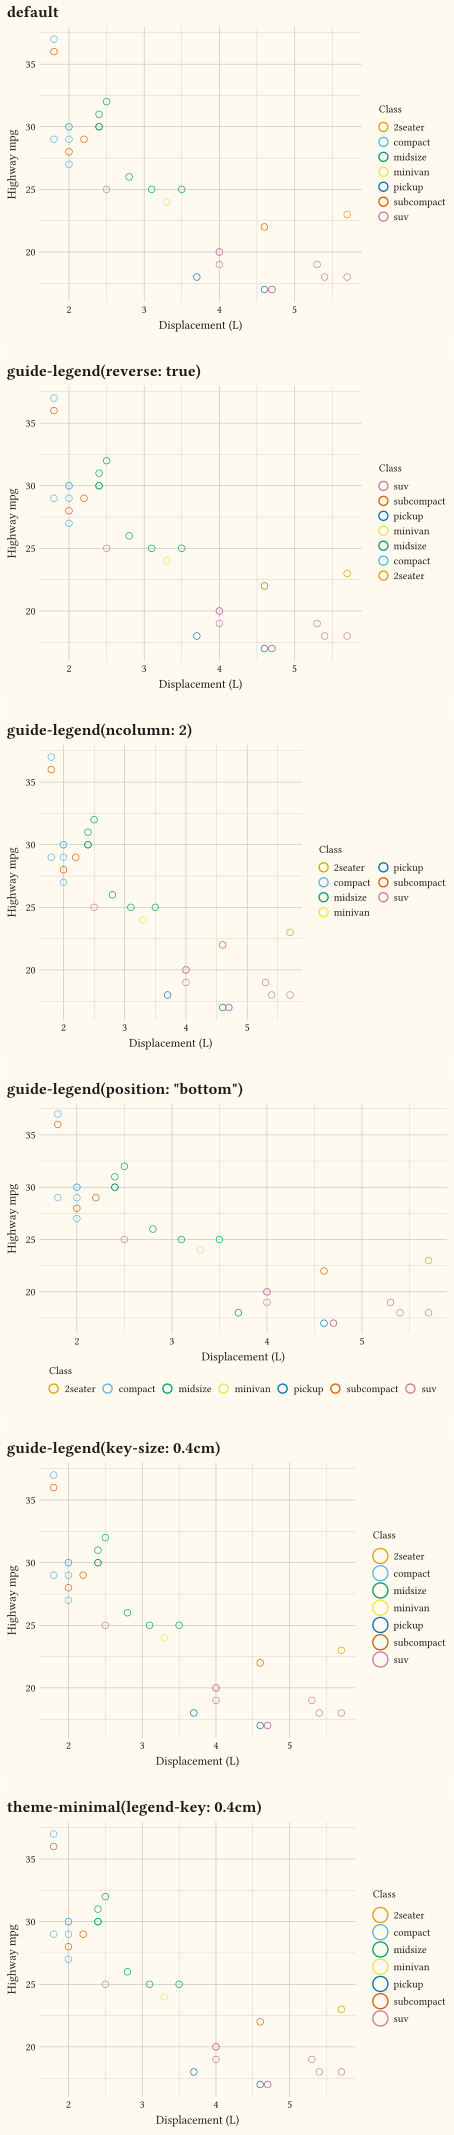
Layout knobs on guide-legend: reverse flips the key order, ncol wraps it onto multiple columns.
any
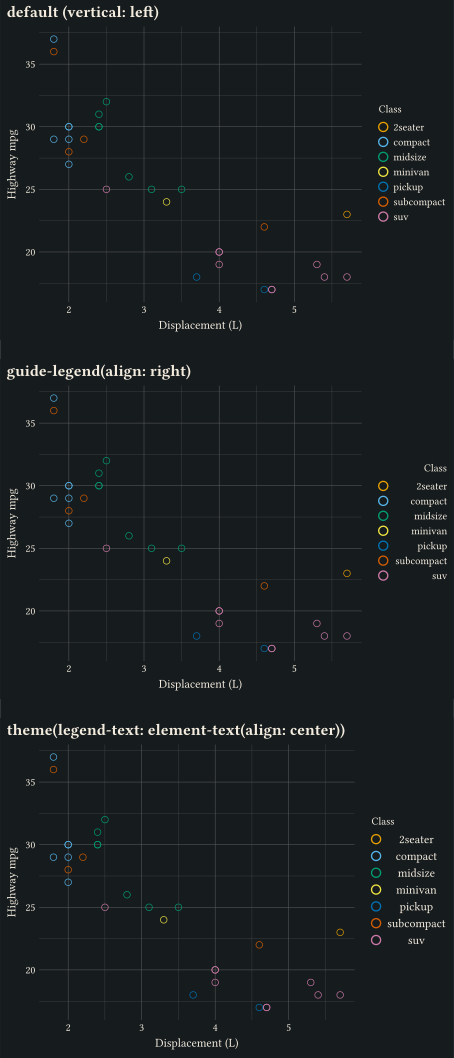
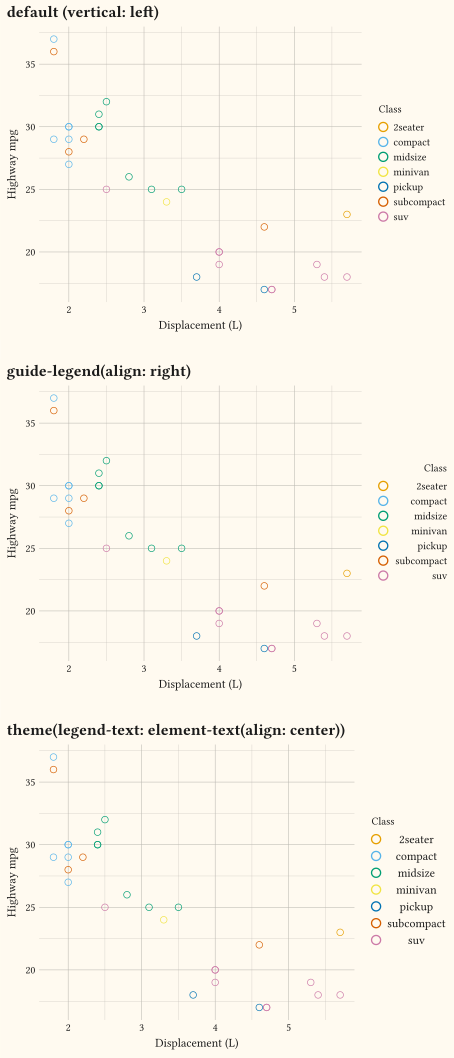
Justify legend entry labels with guide-legend(align:) or theme(legend-text: element-text(align: ...)); horizontal legends centre labels and vertical legends keep them left by default.
any
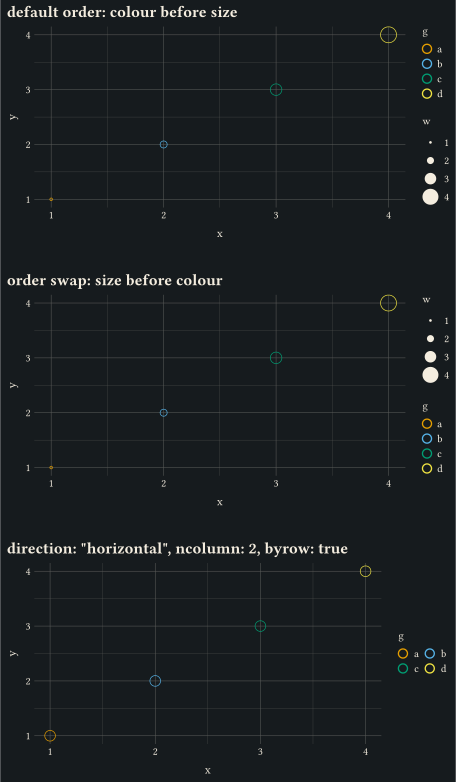
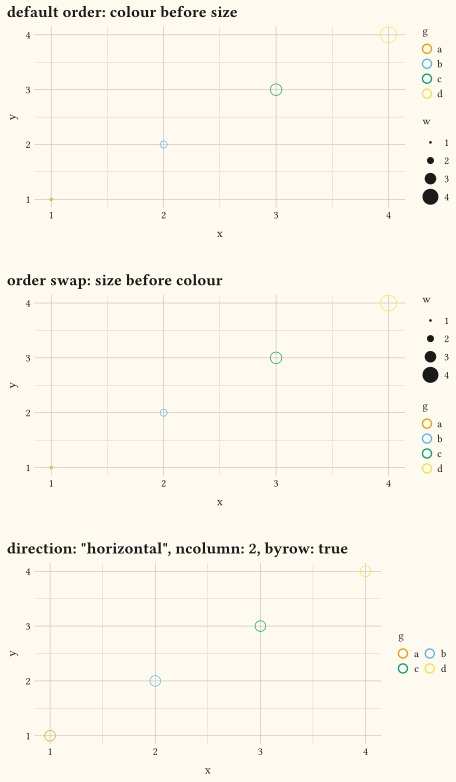
guide-legend order sets stacking priority across aesthetics, while direction and byrow control the swatch grid flow.
any
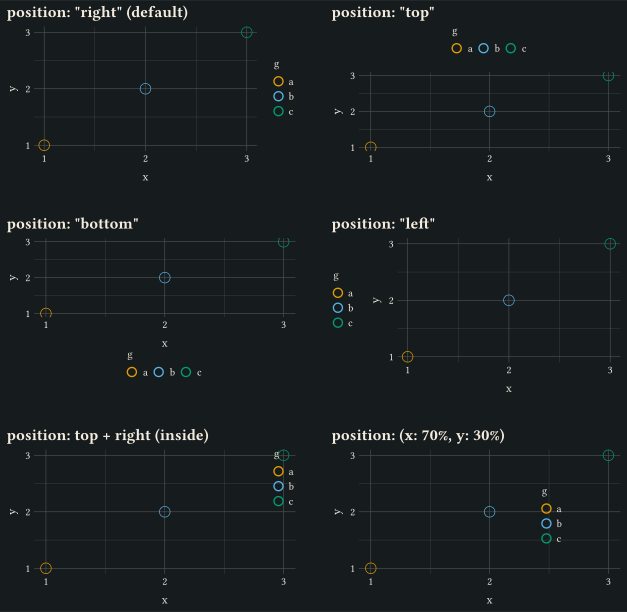
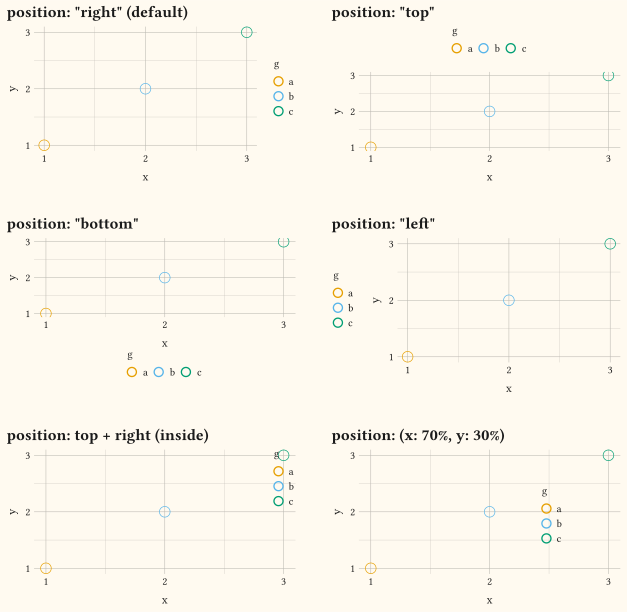
Every guide-legend position value: the four margin sides, an inside corner via a Typst alignment, and an arbitrary (x:, y:) canvas offset.
two numerics
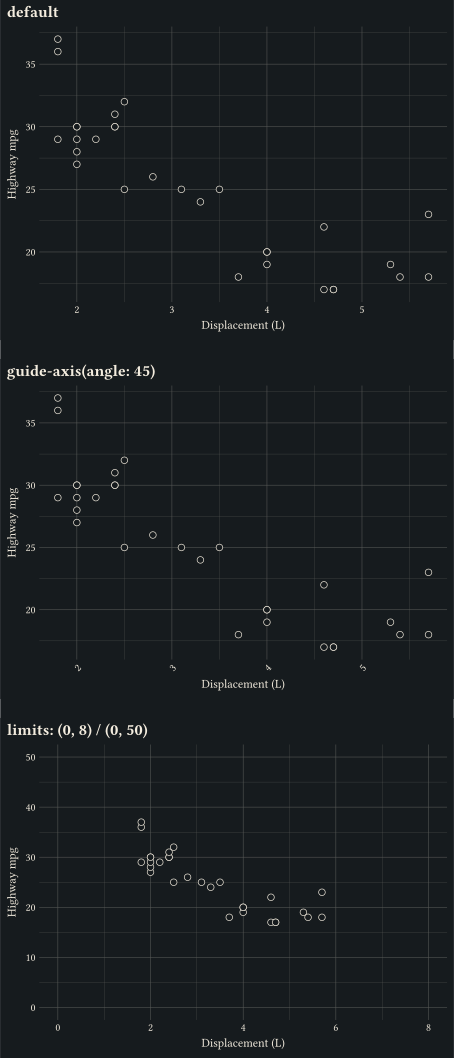
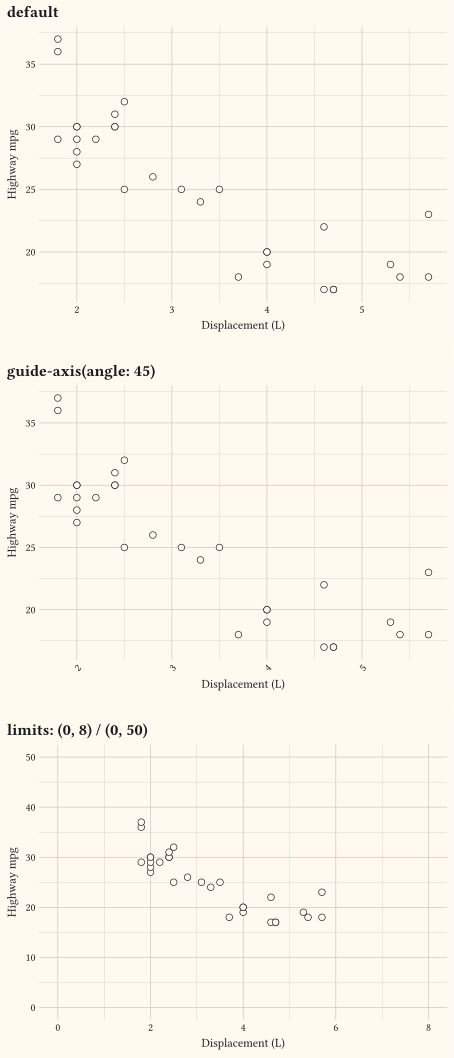
Explicit domains set by scale-continuous(limits:) alongside tidied tick text from guide-axis.
two numerics
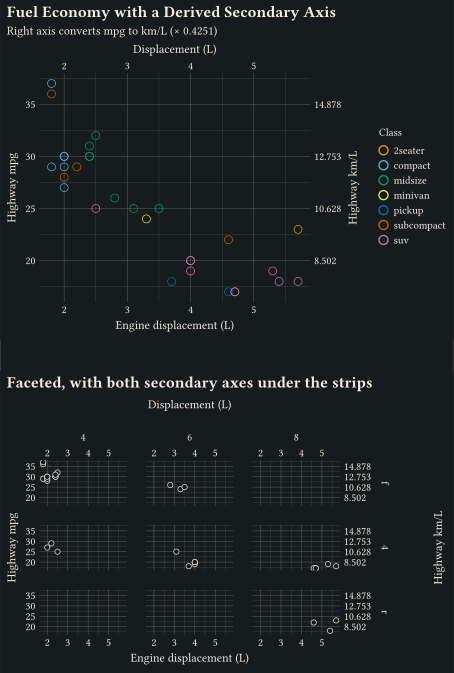
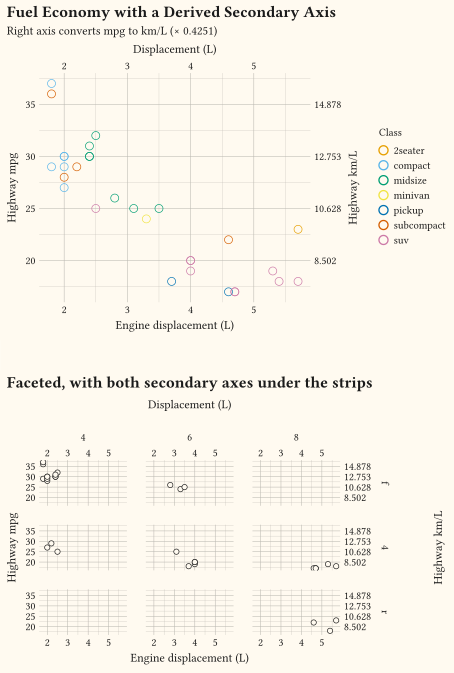
Add a duplicate axis with dup-axis or a derived axis via sec-axis on a continuous scale.
two numerics
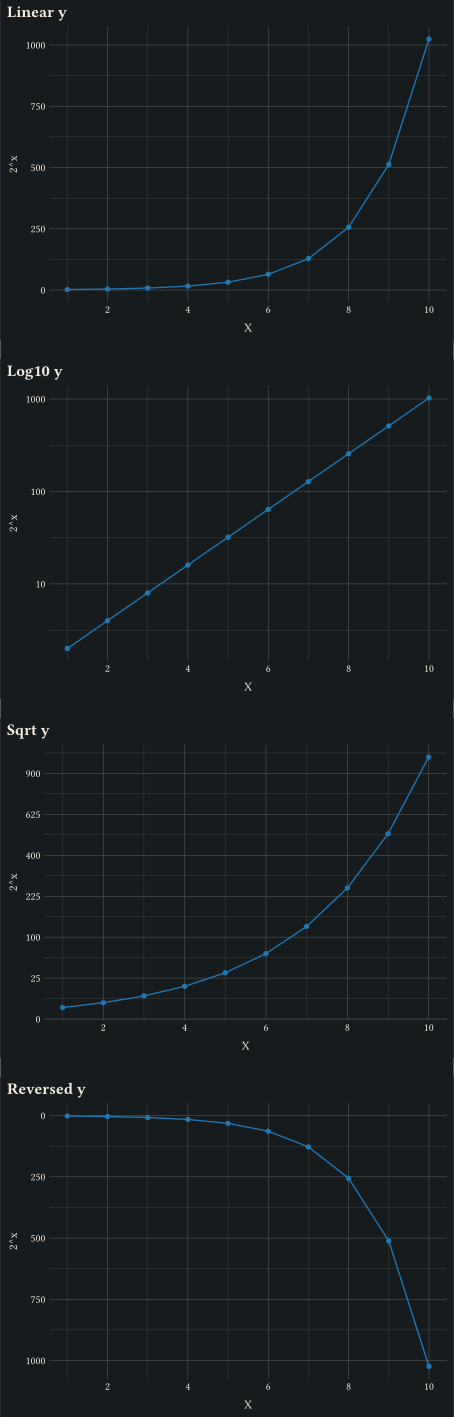
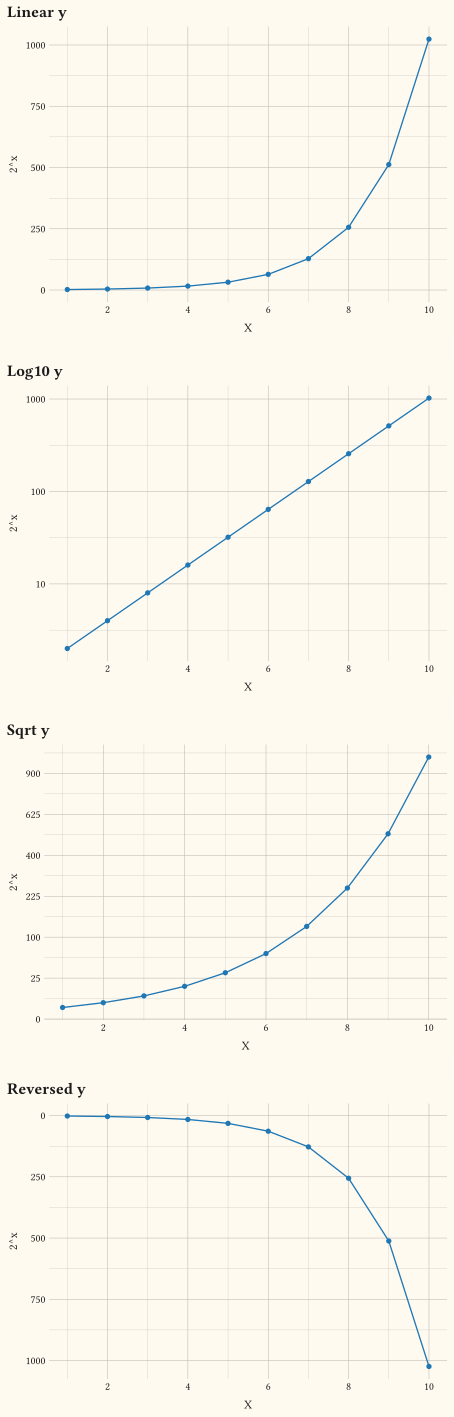
Continuous axis transformations via scale-log10, scale-sqrt, and scale-reverse.
any
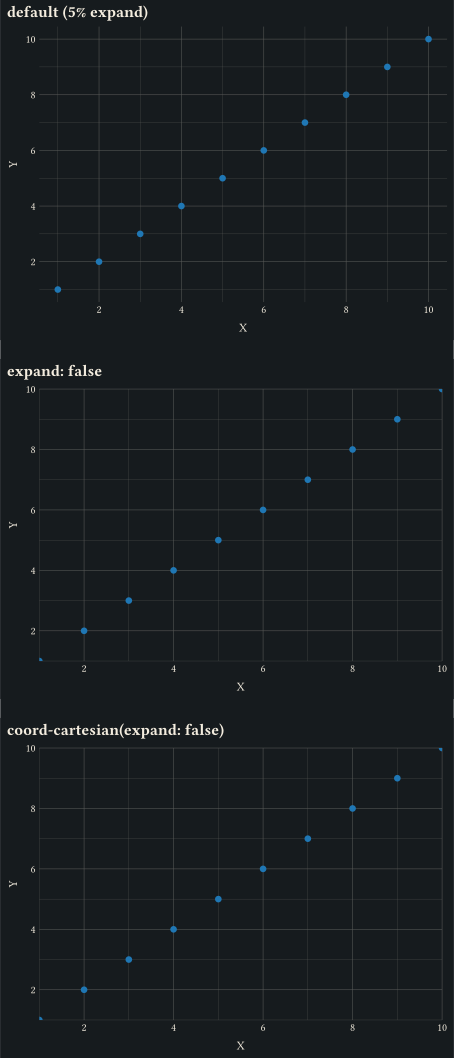
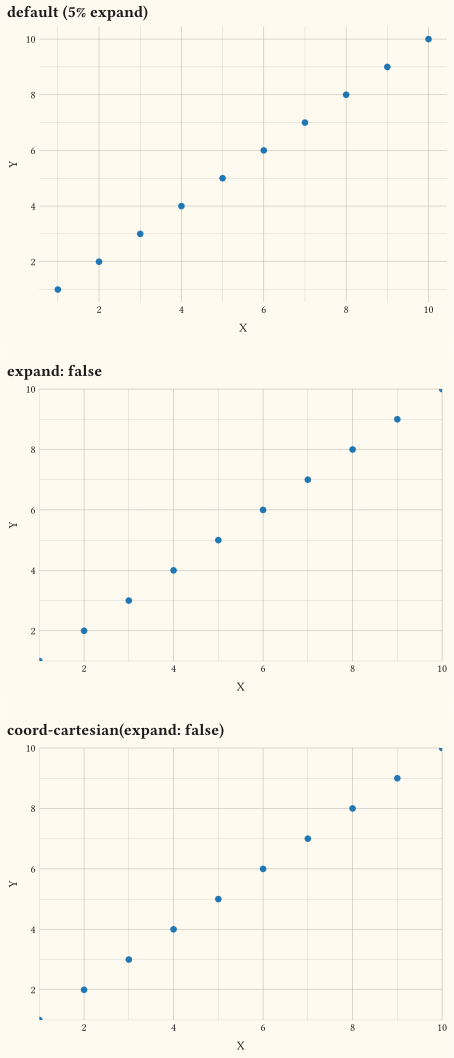
Tune axis breathing room via scale-*-continuous(expand:) or via coord-cartesian(expand: false).
three or more variables
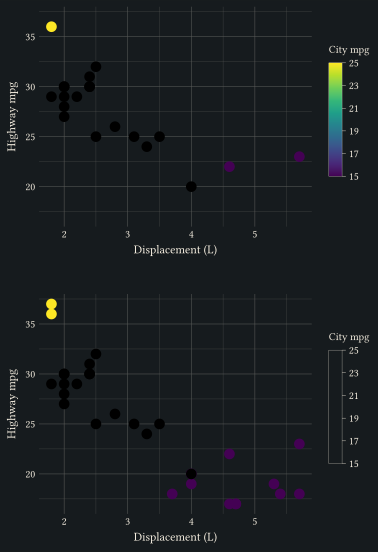
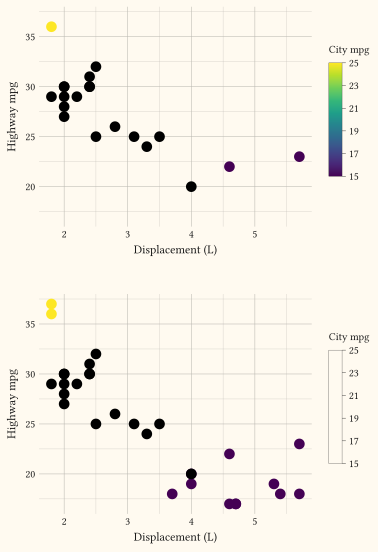
With a scale limits set, oob: "drop" removes out-of-range values while oob: "squish" clamps them to the nearest endpoint of scale-viridis-c.
// guide-axis customises tick label rotation and dodging on a discrete axis.
#import "@preview/gribouille:0.7.0": *
#set page(width: auto, height: auto, margin: 0cm)
#let make-panel(title, gs) = plot(
data: mpg,
mapping: aes(x: "manufacturer"),
layers: (geom-bar(),),
guides: gs,
scales: scales(y: scale-continuous(name: "Vehicles in sample")),
labels: labels(title: title, x: "Manufacturer"),
theme: theme-minimal(),
width: 12cm,
height: 9cm,
)
#grid(
columns: 1,
row-gutter: 0.4cm,
make-panel("Default tick labels overlap", (:)),
make-panel("guides(x: guide-axis(angle: 30))", guides(
x: guide-axis(angle: 30),
)),
make-panel("guides(x: guide-axis(n-dodge: 2))", guides(
x: guide-axis(n-dodge: 2),
)),
)// guide-axis-logticks adds minor ticks at log-scale subdivisions on a log10 axis.
#import "@preview/gribouille:0.7.0": *
#set page(width: auto, height: auto, margin: 0cm)
#let d = (
(x: 1, y: 1),
(x: 3, y: 5),
(x: 10, y: 25),
(x: 30, y: 100),
(x: 100, y: 500),
(x: 300, y: 2500),
(x: 1000, y: 10000),
)
#let panel(title, gs) = plot(
data: d,
mapping: aes(x: "x", y: "y"),
layers: (
geom-line(stroke: 0.6pt, alpha: 0.4),
geom-point(size: 3pt),
),
scales: scales(x: scale-continuous(transform: "log10", labels: format-comma()), y: scale-continuous(transform: "log10", labels: format-comma())),
guides: gs,
labels: labels(title: title, x: "Inputs (log10)", y: "Outputs (log10)"),
theme: theme-minimal(),
width: 12cm,
height: 9cm,
)
#grid(
columns: 1,
row-gutter: 0.5cm,
panel("Decade ticks only", (:)),
panel(
"guide-axis-logticks() on x and y",
guides(x: guide-axis-logticks(), y: guide-axis-logticks()),
),
)// guide-axis-stack pairs a rotated-label pass with the log-tick minor pass
// on the same axis: one row carries readable labels, the next adds dense
// minor ticks below.
#import "@preview/gribouille:0.7.0": *
#set page(width: auto, height: auto, margin: 0cm)
#let d = (
(x: 1, y: 1),
(x: 3, y: 5),
(x: 10, y: 100),
(x: 30, y: 800),
(x: 100, y: 10000),
)
#plot(
data: d,
mapping: aes(x: "x", y: "y"),
layers: (geom-point(size: 3pt),),
scales: scales(x: scale-continuous(transform: "log10"), y: scale-continuous(transform: "log10")),
guides: guides(
x: guide-axis-stack(
guides: (
guide-axis(angle: 30),
guide-axis-logticks(),
),
spacing: 6pt,
),
),
labels: labels(title: "Guide-Axis-Stack: Rotated Labels + Log Minor Ticks"),
theme: theme-minimal(),
width: 12cm,
height: 9cm,
)// guide-axis-theta customises the angular axis under coord-radial: rotate
// theta tick labels, emit minor ticks at half-step positions, and draw an
// outer axis arc that respects the active theta range. The arc reads the
// `axis-line` theme surface and the ticks read `axis-ticks`, both of which
// theme-minimal blanks, so the panels below turn them back on.
#import "@preview/gribouille:0.7.0": *
#set page(width: auto, height: auto, margin: 0cm)
#let scores = (8, 6, 7, 9, 5, 8)
#let car = range(scores.len()).map(i => (axis: i, score: scores.at(i)))
#let ringed = theme-minimal(
axis-line: element-line(stroke: 0.5pt),
axis-ticks: element-tick(length: 0.15cm),
)
#let make-panel(title, gs, theme: ringed) = plot(
data: car,
mapping: aes(x: "axis", y: "score"),
layers: (
geom-polygon(fill: rgb("#1f77b4"), alpha: 0.4, stroke: 0.8pt),
geom-point(size: 2pt),
),
coord: coord-radial(theta: "x"),
scales: scales(
x: scale-continuous(
limits: (0, 6),
labels: v => if v == 6 { none } else { str(v) },
expand: false,
),
y: scale-continuous(limits: (0, 10)),
),
guides: gs,
labels: labels(title: title),
theme: theme,
width: 12cm,
height: 9cm,
)
#grid(
columns: 1,
row-gutter: 0.4cm,
make-panel("theme-minimal(): spokes only", (:), theme: theme-minimal()),
make-panel("axis-ticks: element-tick(length: 0.15cm)", (:)),
make-panel("guide-axis-theta(minor-ticks: true)", guides(
theta: guide-axis-theta(minor-ticks: true),
)),
make-panel("guide-axis-theta(angle: 30, cap: \"both\")", guides(
theta: guide-axis-theta(angle: 30, cap: "both"),
)),
)// guide-custom drops arbitrary Typst content into the legend area alongside
// the auto-built colour swatch.
#import "@preview/gribouille:0.7.0": *
#set page(width: auto, height: auto, margin: 0cm)
#let d = (
(x: 1, y: 1, g: "Setosa"),
(x: 2, y: 2, g: "Versicolor"),
(x: 3, y: 3, g: "Virginica"),
(x: 4, y: 4, g: "Setosa"),
(x: 5, y: 5, g: "Versicolor"),
)
#plot(
data: d,
mapping: aes(x: "x", y: "y", colour: "g"),
layers: (geom-point(size: 3pt),),
guides: guides(
note: guide-custom(
[
#set text(size: 7pt)
Petal-length subset; rows for the original Anderson sample. Refresh quarterly.
],
width: 3cm,
height: auto,
title: "Notes",
),
),
labels: labels(title: "Guide-Custom: Free-Form Legend Slot"),
theme: theme-minimal(),
width: 12cm,
height: 9cm,
)// guide-legend(): customise per-aesthetic legends; pass `none` to suppress one.
#import "@preview/gribouille:0.7.0": *
#set page(width: auto, height: auto, margin: 0cm)
#let make-panel(title, gs, th: theme-minimal()) = plot(
data: mpg,
mapping: aes(x: "displ", y: "hwy", colour: "class"),
layers: (geom-point(size: 2.5pt),),
guides: gs,
labels: labels(
title: title,
x: "Displacement (L)",
y: "Highway mpg",
colour: "Class",
),
theme: th,
width: 12cm,
height: 9cm,
)
#grid(
columns: 1,
row-gutter: 0.5cm,
make-panel("default", (:)),
make-panel("guide-legend(reverse: true)", guides(
colour: guide-legend(reverse: true),
)),
make-panel("guide-legend(ncolumn: 2)", guides(
colour: guide-legend(ncolumn: 2),
)),
make-panel(
"guide-legend(position: \"bottom\")",
guides(colour: guide-legend(position: "bottom")),
),
make-panel(
"guide-legend(key-size: 0.4cm)",
guides(colour: guide-legend(key-size: 0.4cm)),
),
make-panel(
"theme-minimal(legend-key: 0.4cm)",
(:),
th: theme-minimal(legend-key: 0.4cm),
),
)// guide-legend(align:) and the legend-text align: justify entry labels.
#import "@preview/gribouille:0.7.0": *
#set page(width: auto, height: auto, margin: 0cm)
#let make-panel(title, ..args) = plot(
data: mpg,
mapping: aes(x: "displ", y: "hwy", colour: "class"),
layers: (geom-point(size: 2.5pt),),
labels: labels(
title: title,
x: "Displacement (L)",
y: "Highway mpg",
colour: "Class",
),
theme: theme-minimal(),
width: 12cm,
height: 9cm,
..args,
)
#grid(
columns: 1,
row-gutter: 0.5cm,
make-panel("default (vertical: left)"),
make-panel(
"guide-legend(align: right)",
guides: guides(colour: guide-legend(align: right)),
),
make-panel(
"theme(legend-text: element-text(align: center))",
theme: theme-minimal() + theme(legend-text: element-text(align: center)),
),
)// guide-legend(order:, direction:, byrow:): stacking priority and grid flow.
//
// `order` overrides the default aesthetic order (colour, fill, size, ...);
// `direction` flips the swatch flow between vertical and horizontal;
// `byrow` switches the grid fill from column-major to row-major.
#import "@preview/gribouille:0.7.0": *
#set page(width: auto, height: auto, margin: 0cm)
#let d = (
(x: 1, y: 1, g: "a", w: 1),
(x: 2, y: 2, g: "b", w: 2),
(x: 3, y: 3, g: "c", w: 3),
(x: 4, y: 4, g: "d", w: 4),
)
#grid(
columns: 1,
row-gutter: 0.6cm,
plot(
data: d,
mapping: aes(x: "x", y: "y", colour: "g", size: "w"),
layers: (geom-point(),),
labels: labels(title: "default order: colour before size"),
width: 12cm,
height: 6.5cm,
),
plot(
data: d,
mapping: aes(x: "x", y: "y", colour: "g", size: "w"),
layers: (geom-point(),),
guides: guides(
colour: guide-legend(order: 2),
size: guide-legend(order: 1),
),
labels: labels(title: "order swap: size before colour"),
width: 12cm,
height: 6.5cm,
),
plot(
data: d,
mapping: aes(x: "x", y: "y", colour: "g"),
layers: (geom-point(size: 4pt),),
guides: guides(colour: guide-legend(
direction: "horizontal",
ncolumn: 2,
byrow: true,
)),
labels: labels(title: "direction: \"horizontal\", ncolumn: 2, byrow: true"),
width: 12cm,
height: 6.5cm,
),
)// guide-legend(position: ...): every accepted placement value.
//
// The four side strings push the legend into the matching margin; a Typst
// alignment (e.g. top + right) places it inside the panel anchored to that
// corner; a dict (x:, y:) / (dx:, dy:) offsets it anywhere on the canvas.
#import "@preview/gribouille:0.7.0": *
#set page(width: auto, height: auto, margin: 0cm)
#let d = (
(x: 1, y: 1, g: "a"),
(x: 2, y: 2, g: "b"),
(x: 3, y: 3, g: "c"),
)
#let make-panel(title, pos) = plot(
data: d,
mapping: aes(x: "x", y: "y", colour: "g"),
layers: (geom-point(size: 4pt),),
guides: guides(colour: guide-legend(position: pos)),
labels: labels(title: title),
width: 8cm,
height: 5cm,
)
#grid(
columns: 2,
column-gutter: 0.6cm,
row-gutter: 0.6cm,
make-panel("position: \"right\" (default)", "right"),
make-panel("position: \"top\"", "top"),
make-panel("position: \"bottom\"", "bottom"),
make-panel("position: \"left\"", "left"),
make-panel("position: top + right (inside)", top + right),
make-panel("position: (x: 70%, y: 30%)", (x: 70%, y: 30%)),
)// scale-*-continuous(limits:) sets explicit data domains; guide-axis tweaks tick text.
#import "@preview/gribouille:0.7.0": *
#set page(width: auto, height: auto, margin: 0cm)
#let base(title, extra-scales: (:), extra-guides: (:)) = plot(
data: mpg,
mapping: aes(x: "displ", y: "hwy"),
layers: (geom-point(size: 2.5pt, alpha: 0.7),),
scales: extra-scales,
guides: extra-guides,
labels: labels(title: title, x: "Displacement (L)", y: "Highway mpg"),
theme: theme-minimal(),
width: 12cm,
height: 9cm,
)
#grid(
columns: 1,
row-gutter: 0.5cm,
base("default"),
base(
"guide-axis(angle: 45)",
extra-guides: guides(x: guide-axis(angle: 45)),
),
base(
"limits: (0, 8) / (0, 50)",
extra-scales: scales(x: scale-continuous(limits: (0, 8)), y: scale-continuous(limits: (0, 50))),
),
)// dup-axis duplicates an axis; sec-axis derives a transformed companion.
#import "@preview/gribouille:0.7.0": *
#set page(width: auto, height: auto, margin: 0cm)
#stack(
dir: ttb,
spacing: 0.8cm,
plot(
data: mpg,
mapping: aes(x: "displ", y: "hwy", colour: "class"),
layers: (geom-point(size: 3pt, alpha: 0.8),),
scales: scales(
x: scale-continuous(
name: "Engine displacement (L)",
secondary: dup-axis(name: "Displacement (L)"),
),
y: scale-continuous(name: "Highway mpg", secondary: sec-axis(
transform: v => v * 0.4251,
name: "Highway km/L",
)),
),
labels: labels(
title: "Fuel Economy with a Derived Secondary Axis",
subtitle: "Right axis converts mpg to km/L (× 0.4251)",
colour: "Class",
),
theme: theme-minimal(),
width: 12cm,
height: 9cm,
),
// Under facets each secondary axis is drawn between the panel grid and the
// strip band on that side, with its title once at the edge of the grid.
plot(
data: mpg,
mapping: aes(x: "displ", y: "hwy"),
layers: (geom-point(size: 2pt, alpha: 0.8),),
facet: facet-grid(rows: "drv", columns: "cyl"),
scales: scales(
x: scale-continuous(
name: "Engine displacement (L)",
secondary: dup-axis(name: "Displacement (L)"),
),
y: scale-continuous(
name: "Highway mpg",
secondary: sec-axis(transform: v => v * 0.4251, name: "Highway km/L"),
),
),
labels: labels(title: "Faceted, with both secondary axes under the strips"),
theme: theme-minimal(),
width: 12cm,
height: 8cm,
),
)// Continuous axis transformations: log10, sqrt, and reverse on the y axis.
#import "@preview/gribouille:0.7.0": *
#set page(width: auto, height: auto, margin: 0cm)
#let accent = rgb("#1f77b4")
#let d = range(1, 11).map(i => (x: i, y: calc.pow(2, i)))
#let panel(title, scales) = plot(
data: d,
mapping: aes(x: "x", y: "y"),
layers: (
geom-line(stroke: 1pt, colour: accent),
geom-point(size: 2pt, fill: accent),
),
scales: scales,
labels: labels(title: title, x: "X", y: "2^x"),
theme: theme-minimal(),
width: 12cm,
height: 9cm,
)
#grid(
columns: 1,
row-gutter: 0.5cm,
panel("Linear y", (:)),
panel("Log10 y", scales(y: scale-log10())),
panel("Sqrt y", scales(y: scale-sqrt())),
panel("Reversed y", scales(y: scale-reverse())),
)// scale-*-continuous(expand:) and coord-cartesian(expand: false) tune
// the breathing room around the data.
#import "@preview/gribouille:0.7.0": *
#set page(width: auto, height: auto, margin: 0cm)
#let pts = range(1, 11).map(i => (x: i, y: i))
#let base(title, scales: (:), coord-arg: none) = plot(
data: pts,
mapping: aes(x: "x", y: "y"),
layers: (geom-point(size: 2.5pt, fill: rgb("#1f77b4")),),
scales: scales,
coord: coord-arg,
labels: labels(title: title, x: "X", y: "Y"),
theme: theme-minimal(),
width: 12cm,
height: 9cm,
)
#grid(
columns: 1,
row-gutter: 0.5cm,
base("default (5% expand)"),
base(
"expand: false",
scales: scales(x: scale-continuous(expand: false), y: scale-continuous(expand: false)),
),
base(
"coord-cartesian(expand: false)",
coord-arg: coord-cartesian(expand: false),
),
)// Out-of-range handling when a scale `limits` is set.
//
// Default `oob: "drop"` removes rows whose mapped value falls outside the
// limits; `oob: "squish"` clamps them to the nearest endpoint instead.
#import "@preview/gribouille:0.7.0": *
#set page(width: auto, height: auto, margin: 0cm)
#let base(extra-scales) = plot(
data: mpg,
mapping: aes(x: "displ", y: "hwy", fill: "cty"),
layers: (geom-point(size: 4pt, alpha: 0.85),),
scales: extra-scales,
labels: labels(
x: "Displacement (L)",
y: "Highway mpg",
fill: "City mpg",
),
theme: theme-minimal(),
width: 10cm,
height: 7cm,
)
#grid(
columns: 1,
row-gutter: 0.6cm,
base(scales(fill: scale-viridis-c(limits: (15, 25)))),
base(scales(fill: scale-viridis-c(limits: (15, 25), oob: "squish"))),
)