scale-reverse
Position scale with the axis direction reversed (x or y).
Tick labels stay in data units; only the axis direction flips.
Usage
scale-reverse(
  ..args,
)
Parameters
| Parameter | Default | Description |
|---|---|---|
..args |
Named arguments forwarded to the axis scale. |
Keys accepted by ..args:
name: Axis or legend title, as a string or content;none(default) falls back to the mapped column name.limits: Domain as a(lo, hi)pair, where either side may beautoto train that side from the data;none(default) trains both sides.oob: Handling of rows outsidelimits:"drop"(default) removes them,"squish"clamps them to the nearest limit.breaks: Array of tick positions in data units, a bare number for a single tick, a function of the trained values returning positions (thebreaks-*helpers return such a function), orauto(default) for computed breaks.minor-breaks: Array of minor-gridline positions in data units, a function of the trained values returning positions (thebreaks-*helpers return such a function), orauto(default) to subdivide the majors, halfway between them in transformed space.n-minor: Integer count of minor gridlines between adjacent majors, orauto(default) for one; ignored whenminor-breaksis set.labels: Array of labels aligned with the breaks, a function of the break value returning a string or content (theformat-*helpers return such a function), orauto(default) to format each break.
Returns
Deferred scale spec consumed by scales.
Examples
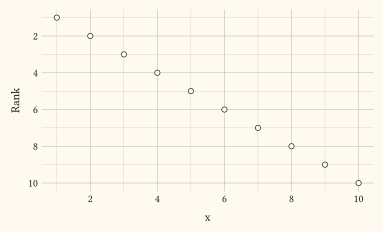
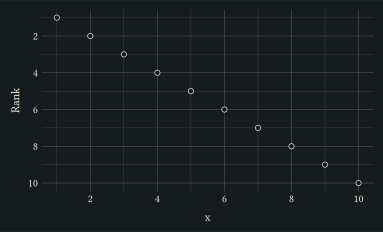
Reverse the y axis so larger values sit at the bottom.
#let d = range(1, 11).map(i => (x: i, y: i))
#plot(
  data: d,
  mapping: aes(x: "x", y: "y"),
  layers: (geom-point(size: 2pt),),
  scales: scales(y: scale-reverse(name: "Rank")),
  width: 10cm,
  height: 6cm,
)