position-beeswarm
Density-shaped per-row offset on x.
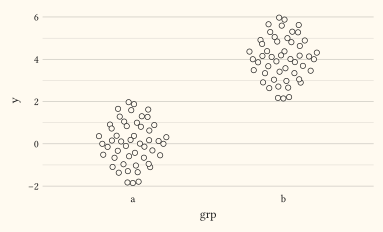
For every bucket of rows sharing an x value, each point is offset sideways by width × (2·v − 1) × d, where v walks the van der Corput base-2 sequence in y order and d is the point’s Gaussian kernel density estimate normalised to the bucket’s peak. Dense regions spread wide, sparse tails stay close to the spine, and the result is a violin-shaped swarm.
A discrete (categorical) x is swarmed directly on its level positions, keeping the axis labels. as-factor is only needed to force a numeric column onto a discrete axis.
Usage
position-beeswarm(
  width: 0.4,
  adjust: 1,
)
Parameters
| Parameter | Default | Description |
|---|---|---|
width |
0.4 |
Maximum absolute offset applied to the x position, in x data units. |
adjust |
1 |
Bandwidth multiplier for the density estimate: adjust: 0.5 halves the smoothing. |
Returns
Position dictionary with name: "beeswarm", consumed by plot.
Examples
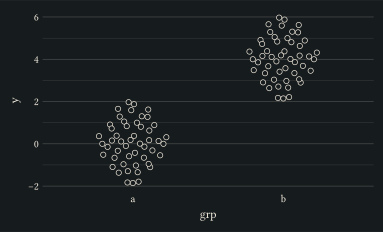
Swarm overplotted points per group; a tighter width keeps the cloud close to its spine.
#let d = ()
#for grp in ("a", "b") {
  for i in range(0, 50) {
    d.push((grp: grp, y: calc.sin(i * 0.7) + calc.sin(i * 1.9) + (if grp == "b" { 4 } else { 0 })))
  }
}
#plot(
  data: d,
  mapping: aes(x: as-factor("grp"), y: "y"),
  layers: (geom-point(size: 2pt, position: position-beeswarm(width: 0.25)),),
  width: 10cm,
  height: 6cm,
)