scale-binned
Binned scale that quantises a continuous variable into n-breaks bins.
Valid on x/y, size, alpha, linewidth, stroke, shape, and linetype; the per-row mapping stays continuous while the legend or axis snaps to bin midpoints.
Usage
scale-binned(
  ..args,
)
Parameters
| Parameter | Default | Description |
|---|---|---|
..args |
Named arguments forwarded to the bound scale. |
Keys accepted by ..args:
name: Axis or legend title, as a string or content;none(default) falls back to the mapped column name.limits: Domain as a(lo, hi)pair, where either side may beautoto train that side from the data;none(default) trains both sides.oob: Handling of rows outsidelimits:"drop"(default) removes them,"squish"clamps them to the nearest limit.n-breaks: Integer number of equal-width bins used whenbreaksisauto; default 10 onx/yand 4 on the other aesthetics.breaks: Array of bin edges, a function of the trained values returning edges (thebreaks-*helpers return such a function), ticked at the bin midpoints and overridingn-breaks, orauto(default) to cutn-breaksequal-width bins.labels: Array of labels aligned with the breaks, a function of the break value returning a string or content (theformat-*helpers return such a function), orauto(default) to format each break.range: Output(lo, hi)pair: lengths forsize(default(1pt, 6pt)),linewidth(default(0.4pt, 1.4pt)), andstroke(default(0.2pt, 1.4pt)); numbers in[0, 1]foralpha(default(0.1, 1)).palette: Array of per-bin output values: marker keywords forshape, dash keywords forlinetype.auto(default) uses that aesthetic’s built-in set.
Returns
Deferred scale spec consumed by scales.
Examples
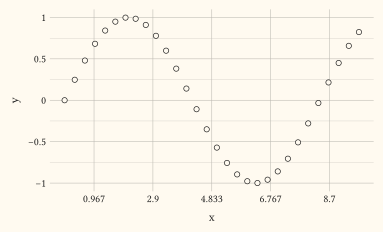
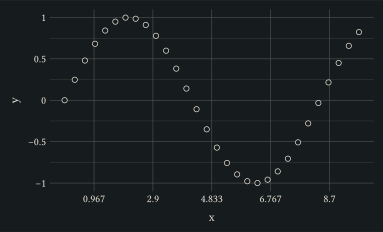
Quantise the x axis into five equal-width bins.
#let d = range(0, 30).map(i => (x: i / 3.0, y: calc.sin(i / 4.0)))
#plot(
  data: d,
  mapping: aes(x: "x", y: "y"),
  layers: (geom-point(size: 2pt),),
  scales: scales(x: scale-binned(n-breaks: 5)),
  width: 10cm,
  height: 6cm,
)