scale-identity
Identity scale: use each row’s value as the visual output directly.
Valid on colour/fill, alpha, size, linewidth, stroke, shape, and linetype. Draws no legend.
Usage
scale-identity(
  ..args,
)
Parameters
| Parameter | Default | Description |
|---|---|---|
..args |
Named arguments forwarded to the bound scale. |
Keys accepted by ..args:
name: Axis or legend title, as a string or content;none(default) falls back to the mapped column name.
Returns
Deferred scale spec consumed by scales.
Examples
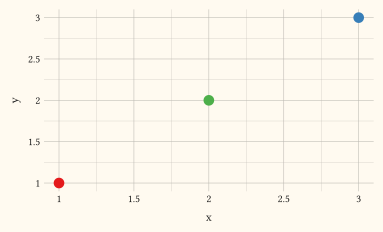
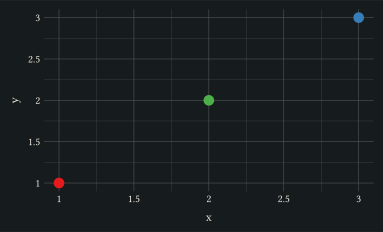
Use a column of colours directly as the fill with an identity scale.
#let d = (
  (x: 1, y: 1, c: rgb("#e41a1c")),
  (x: 2, y: 2, c: rgb("#4daf4a")),
  (x: 3, y: 3, c: rgb("#377eb8")),
)
#plot(
  data: d,
  mapping: aes(x: "x", y: "y", fill: "c"),
  layers: (geom-point(size: 4pt),),
  scales: scales(fill: scale-identity()),
  width: 10cm,
  height: 6cm,
)