geom-density
Density layer: Gaussian kernel density estimate of the x aesthetic.
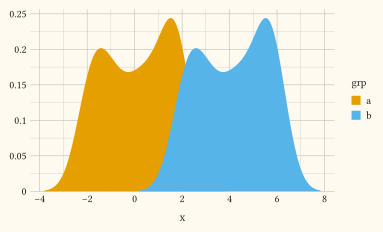
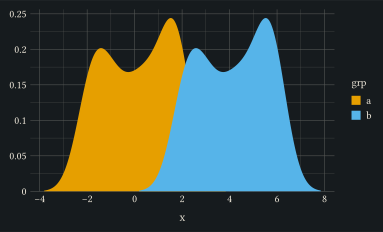
Mapping must provide x. Discrete colour, fill, or group mappings split rows into one density curve per group.
Usage
geom-density(
  mapping: none,
  data: none,
  bw: auto,
  adjust: 1,
  n: 512,
  trim: false,
  colour: auto,
  fill: auto,
  stroke: auto,
  alpha: auto,
  stat: auto,
  position: "identity",
  key: auto,
  inherit-aes: true,
)
Parameters
| Parameter | Default | Description |
|---|---|---|
mapping |
none |
Layer-specific aesthetic mapping built with aes. Must map x. |
data |
none |
Layer-specific dataset, or a function applied to the plot data returning the layer frame. Falls back to the plot data when none. |
bw |
auto |
Kernel bandwidth. auto applies Silverman’s rule of thumb; pass a positive number to fix it. |
adjust |
1 |
Bandwidth multiplier: adjust: 0.5 halves the smoothing, adjust: 2 doubles it. |
n |
512 |
Number of evenly spaced grid points the density is evaluated at. |
trim |
false |
Whether to restrict the curve to the data range instead of letting it decay to the baseline. |
colour |
auto |
Fixed outline colour. auto resolves via the colour scale, falling back to the theme ink. |
fill |
auto |
Fixed fill colour under the curve. auto (default) leaves the curve unfilled until the fill aesthetic is mapped, then shades under it via the fill scale; a fixed colour fills unconditionally and none disables the fill. |
stroke |
auto |
Outline thickness (a Typst length) or stroke dictionary; none disables the outline. |
alpha |
auto |
Fill opacity in [0, 1]. |
stat |
auto |
Statistical transform. auto builds stat-density from the parameters above; pass a stat name or stat object to override. |
position |
"identity" |
Position adjustment name. Usually "identity". |
key |
auto |
Legend glyph override built with a draw-key-* helper. auto picks the default for the geom. |
inherit-aes |
true |
Whether to merge the plot-level mapping into this layer’s mapping. |
Returns
Layer dictionary consumed by plot.
Examples
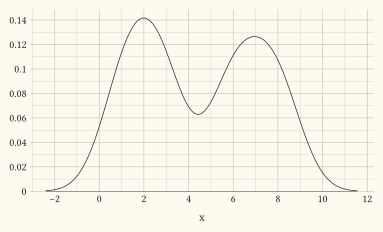
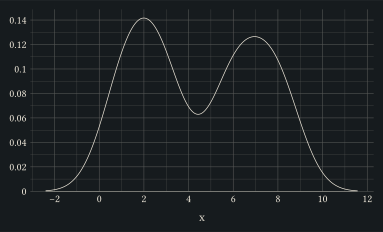
Density curve of a bimodal sample.
#let d = range(0, 60).map(i => (
  x: if calc.rem(i, 2) == 0 { 2 + calc.sin(i * 1.3) * 1.2 } else {
    7 + calc.cos(i * 0.9) * 1.4
  },
))
#plot(
  data: d,
  mapping: aes(x: "x"),
  layers: (geom-density(),),
  width: 10cm,
  height: 6cm,
)
Map fill to a discrete column to overlay one shaded density per group.
#let d = ()
#for grp in ("a", "b") {
  for i in range(0, 40) {
    d.push((x: calc.sin(i * 0.7) * 2 + (if grp == "b" { 4 } else { 0 }), grp: grp))
  }
}
#plot(
  data: d,
  mapping: aes(x: "x", fill: "grp"),
  layers: (geom-density(alpha: 0.4),),
  width: 10cm,
  height: 6cm,
)