stat-waffle
Waffle statistic: turn per-group counts into unit grid cells.
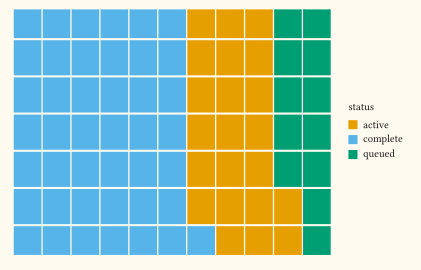
Counts one cell per row, or the rounded sum of the weight aesthetic when mapped (the pre-aggregated (category, count) case). Cells fill the grid column-major from the bottom-left: rows cells stack up a column, then the next column starts. Groups (usually the fill aesthetic) occupy consecutive runs in first-appearance order, so the grid reads as a whole made of parts. The stat emits integer x/y centres for geom-tile; no input x/y mapping is needed.
Usage
stat-waffle(
  rows: 10,
)
Parameters
| Parameter | Default | Description |
|---|---|---|
rows |
10 |
Grid height in cells (a positive integer). Columns grow as needed to hold the total count. |
Returns
Statistic object with name: "waffle", consumed by geom layers (usually geom-tile).
Outputs
x.y.
Examples
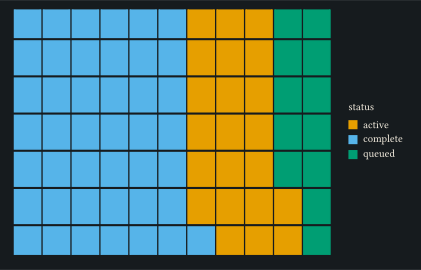
Waffle chart of pre-aggregated counts: one square per unit, coloured by status.
#let d = (
  (status: "complete", n: 43),
  (status: "active", n: 22),
  (status: "queued", n: 12),
)
#plot(
  data: d,
  mapping: aes(fill: "status", weight: "n"),
  layers: (geom-tile(stat: stat-waffle(rows: 7), width: 0.9, height: 0.9),),
  labels: labels(x: "", y: ""),
  guides: guides(x: none, y: none),
  theme: theme-void(),
  width: 11cm,
  height: 7cm,
)