scale-manual
Manual discrete scale: supply a per-level array of output values.
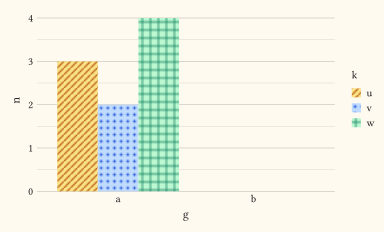
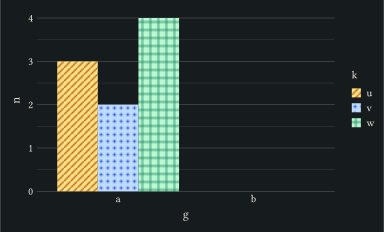
Valid on colour/fill, alpha, size, linewidth, stroke, shape, and linetype. Pass the outputs through values. Fill values accept any Typst paint: native tiling patterns distinguish levels without relying on colour, and the legend swatches render them too. Per-row alpha does not apply to non-colour paints.
Usage
scale-manual(
  ..args,
)
Parameters
| Parameter | Default | Description |
|---|---|---|
..args |
Named arguments forwarded to the bound scale. |
Keys accepted by ..args:
values: Array of output values in level order, recycled when shorter than the number of levels: any Typst paint forcolour/fill, numbers in[0, 1]foralpha, lengths forsize/linewidth/stroke, marker keywords forshape, and dash keywords forlinetype. Default()holds no value, so pass at least one.name: Axis or legend title, as a string or content;none(default) falls back to the mapped column name.limits: Array of level names selecting which levels appear and in which order;none(default) keeps the trained levels. A level name must be a string, because a discrete scale reads a bare number as a position rather than as a level, so quote a numeric level as"1".oob: Handling of rows whose level falls outsidelimits:"drop"(default) removes them;"squish"censors too, since clamping has no meaning on levels.labels: Array of labels in level order, a function of the level returning a string or content, orauto(default) to print the level itself.
Returns
Deferred scale spec consumed by scales.
Examples
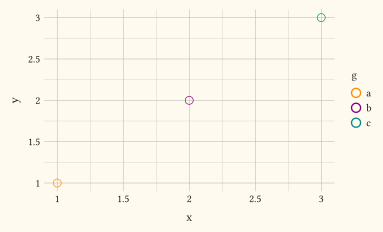
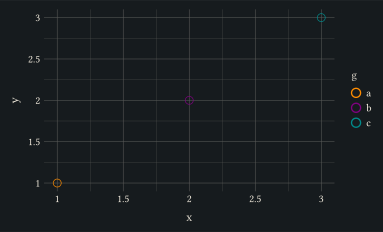
Assign explicit per-level colours with a manual scale.
#let d = ((x: 1, y: 1, g: "a"), (x: 2, y: 2, g: "b"), (x: 3, y: 3, g: "c"))
#plot(
  data: d,
  mapping: aes(x: "x", y: "y", colour: "g"),
  layers: (geom-point(size: 3pt),),
  scales: scales(colour: scale-manual(
    values: (rgb("#ff8c00"), rgb("#800080"), rgb("#008B8B")),
  )),
  width: 10cm,
  height: 6cm,
)
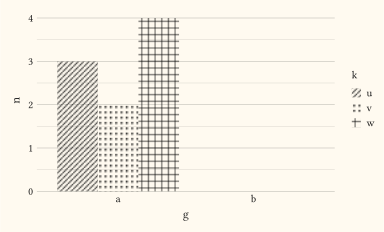
Pattern fills: native Typst tilings keep dodged bars distinguishable in black-and-white print.
#let stripes = tiling(size: (4pt, 4pt))[
  #place(line(start: (0%, 100%), end: (100%, 0%), stroke: 0.7pt + black))
]
#let dots = tiling(size: (4pt, 4pt))[
  #place(dx: 1pt, dy: 1pt, circle(radius: 0.8pt, fill: black))
]
#let cross = tiling(size: (5pt, 5pt))[
  #place(line(start: (0%, 50%), end: (100%, 50%), stroke: 0.5pt + black))
  #place(line(start: (50%, 0%), end: (50%, 100%), stroke: 0.5pt + black))
]
#let d = (
  (g: "a", k: "u", n: 3), (g: "a", k: "v", n: 2), (g: "a", k: "w", n: 4),
  (g: "b", k: "u", n: 4), (g: "b", k: "v", n: 3), (g: "b", k: "w", n: 2),
)
#plot(
  data: d,
  mapping: aes(x: "g", y: "n", fill: "k"),
  layers: (geom-col(position: "dodge"),),
  scales: scales(fill: scale-manual(values: (stripes, dots, cross))),
  width: 10cm,
  height: 6cm,
)
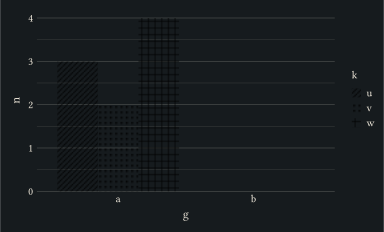
A tiling can carry both a base fill colour and a pattern: place a full-tile box for the background, then the pattern marks on top. Each level gets its own colour-and-pattern pair and the legend swatches show both.
#let stripes(base, ink) = tiling(size: (5pt, 5pt))[
  #place(box(width: 5pt, height: 5pt, fill: base))
  #place(line(start: (0%, 100%), end: (100%, 0%), stroke: 1pt + ink))
]
#let dots(base, ink) = tiling(size: (5pt, 5pt))[
  #place(box(width: 5pt, height: 5pt, fill: base))
  #place(dx: 1.5pt, dy: 1.5pt, circle(radius: 1pt, fill: ink))
]
#let cross(base, ink) = tiling(size: (6pt, 6pt))[
  #place(box(width: 6pt, height: 6pt, fill: base))
  #place(line(start: (0%, 50%), end: (100%, 50%), stroke: 0.7pt + ink))
  #place(line(start: (50%, 0%), end: (50%, 100%), stroke: 0.7pt + ink))
]
#let d = (
  (g: "a", k: "u", n: 3), (g: "a", k: "v", n: 2), (g: "a", k: "w", n: 4),
  (g: "b", k: "u", n: 4), (g: "b", k: "v", n: 3), (g: "b", k: "w", n: 2),
)
#plot(
  data: d,
  mapping: aes(x: "g", y: "n", fill: "k"),
  layers: (geom-col(position: "dodge"),),
  scales: scales(fill: scale-manual(values: (
    stripes(rgb("#fde68a"), rgb("#b45309")),
    dots(rgb("#bfdbfe"), rgb("#1d4ed8")),
    cross(rgb("#bbf7d0"), rgb("#047857")),
  ))),
  width: 10cm,
  height: 6cm,
)