stat-connect
Connection statistic: expand consecutive points with intermediate vertices.
Modes:
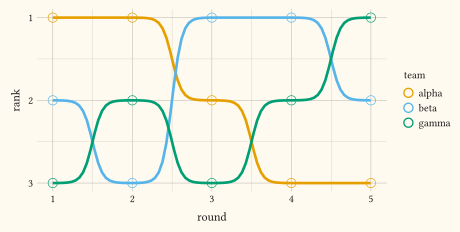
"hv"(default): horizontal then vertical. Inserts(x_{i+1}, y_i)between each pair."vh": vertical then horizontal. Inserts(x_i, y_{i+1})."mid": half-step both ways. Inserts(mid, y_i)and(mid, y_{i+1})at the midpoint."sigmoid": logistic S-curve. Insertsnvertices easing y between the pair, rescaled so the curve passes exactly through both observations; the bump-chart connector."linear": pass-through (no intermediate vertices).
Usage
stat-connect(
  connection: "hv",
  smooth: 8,
  n: 20,
)
Parameters
| Parameter | Default | Description |
|---|---|---|
connection |
"hv" |
Connection mode ("hv" / "vh" / "mid" / "sigmoid" / "linear"). |
smooth |
8 |
Steepness of the "sigmoid" S-curve (a positive number). Larger values flatten the shoulders and sharpen the middle transition; ignored by the other modes. |
n |
20 |
Number of intermediate vertices inserted per gap by "sigmoid" (a positive integer); ignored by the other modes. |
Returns
Statistic object with name: "connect", consumed by geom layers.
Outputs
x.y.
Examples
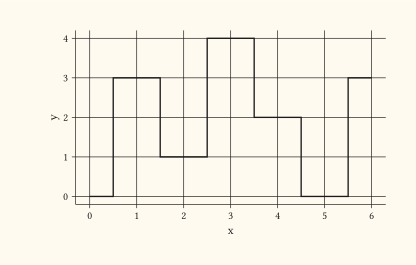
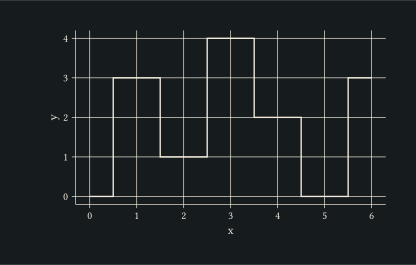
Step-style line via "mid": midpoint corners between consecutive observations.
#let d = range(0, 7).map(i => (x: i, y: calc.rem(i * 3, 5)))
#plot(
  data: d,
  mapping: aes(x: "x", y: "y"),
  layers: (geom-path(stat: stat-connect(connection: "mid"), stroke: 1pt),),
  width: 10cm,
  height: 6cm,
)
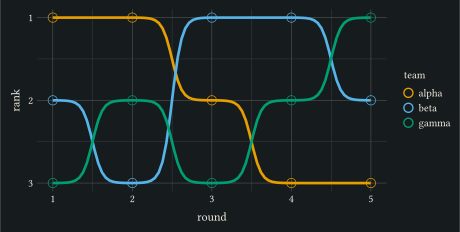
Bump chart: rank trajectories eased through sigmoid connectors, rank 1 on top via a reversed y scale.
#let ranks = (
  alpha: (1, 1, 2, 3, 3),
  beta: (2, 3, 1, 1, 2),
  gamma: (3, 2, 3, 2, 1),
)
#let d = ()
#for (team, rs) in ranks {
  for (i, r) in rs.enumerate() { d.push((round: i + 1, rank: r, team: team)) }
}
#plot(
  data: d,
  mapping: aes(x: "round", y: "rank", colour: "team"),
  layers: (
    geom-line(stat: stat-connect(connection: "sigmoid"), stroke: 2pt),
    geom-point(size: 3.5pt),
  ),
  scales: scales(
    y: scale-continuous(transform: "reverse", breaks: (1, 2, 3)),
  ),
  width: 12cm,
  height: 6cm,
)