geom-density-2d-filled
Filled 2D density layer: shaded bands of the estimated (x, y) density.
Mapping must provide x and y; the layer accepts raw observations, no pre-computed grid is needed. The stat binds fill to the band’s density level, so a continuous fill scale shades by height.
Usage
geom-density-2d-filled(
  mapping: none,
  data: none,
  bw: auto,
  adjust: 1,
  n: 25,
  bins: 10,
  binwidth: none,
  breaks: auto,
  colour: auto,
  fill: auto,
  stroke: none,
  alpha: auto,
  stat: auto,
  position: "identity",
  key: auto,
  inherit-aes: true,
)
Parameters
| Parameter | Default | Description |
|---|---|---|
mapping |
none |
Layer-specific aesthetic mapping built with aes. Must map x and y. |
data |
none |
Layer-specific dataset, or a function applied to the plot data returning the layer frame. Falls back to the plot data when none. |
bw |
auto |
Kernel standard deviation per axis. auto derives it per axis from R’s bw.nrd / 4; pass a number for both axes or an (x, y) tuple. |
adjust |
1 |
Bandwidth multiplier: adjust: 0.5 halves the smoothing. |
n |
25 |
Density grid resolution per axis: a number or an (x, y) tuple. |
bins |
10 |
Target band count when breaks and binwidth are unset. |
binwidth |
none |
Fixed step between band edges. Overrides bins. |
breaks |
auto |
Explicit array of band edges. Overrides bins and binwidth. |
colour |
auto |
Fixed polygon outline colour. auto resolves via the colour scale. |
fill |
auto |
Fixed band fill. auto shades by density level through the fill scale. |
stroke |
none |
Outline thickness (a Typst length); none (default) keeps the per-cell tiling seamless. |
alpha |
auto |
Fill opacity in [0, 1]. |
stat |
auto |
Statistical transform. auto builds stat-density-2d-filled from the parameters above; pass a stat name or stat object to override. |
position |
"identity" |
Position adjustment name. Usually "identity". |
key |
auto |
Legend glyph override built with a draw-key-* helper. auto picks the default for the geom. |
inherit-aes |
true |
Whether to merge the plot-level mapping into this layer’s mapping. |
Returns
Layer dictionary consumed by plot.
Examples
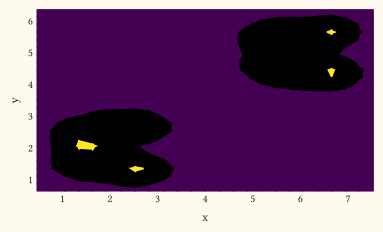
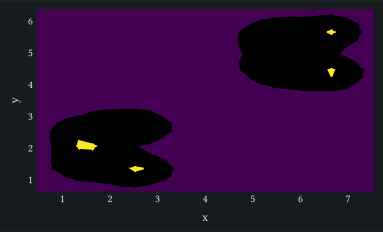
Shaded density bands of two point clouds.
#let d = range(0, 60).map(i => {
  let lobe = calc.rem(i, 2)
  (
    x: 2 + lobe * 4 + calc.sin(i * 1.7) * 0.8,
    y: 2 + lobe * 3 + calc.cos(i * 2.3) * 0.8,
  )
})
#plot(
  data: d,
  mapping: aes(x: "x", y: "y"),
  layers: (geom-density-2d-filled(),),
  scales: scales(
    x: scale-continuous(expand: (0,0)),
    y: scale-continuous(expand: (0,0)),
  ),
  width: 10cm,
  height: 6cm,
)
See also
stat-density-2d-filled, geom-density-2d, geom-contour-filled.