breaks-log
Breaks at powers of a base.
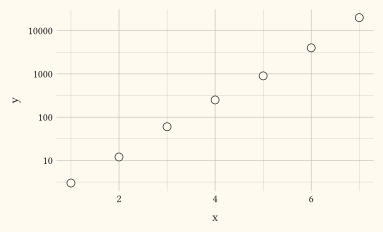
Places a tick on each power of base that the data spans, thinning them when the span is wide. When too few powers fall inside the range, sub-decade steps fill in, best bisection first, the way scales::breaks_log() does. Pair it with transform: "log10", where evenly spaced powers are what the axis draws.
A break is undefined at or below zero, so non-positive values drop out the way a log axis drops them. A scale that trained on values and kept none of them has no breaks to place and fails, rather than drawing an axis with no ticks and no reason given. A scale that trained on nothing at all is not that case, and answers no breaks as every other helper does.
Usage
breaks-log(
  n: 5,
  base: 10,
)
Parameters
| Parameter | Default | Description |
|---|---|---|
n |
5 |
Target number of ticks; the fill-in stops once the count is near it, so the result may hold one or two more or fewer. |
base |
10 |
Base of the powers; must be above 1. It is independent of the scale transform, so base: 2 on a "log10" axis places its ticks at powers of two, spaced unevenly on screen. |
Returns
Closure taking the trained values and returning break positions.
Examples
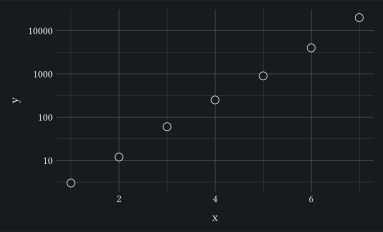
A tick on every decade of a log axis.
#plot(
  data: (
    (x: 1, y: 3), (x: 2, y: 12), (x: 3, y: 60), (x: 4, y: 250),
    (x: 5, y: 900), (x: 6, y: 4000), (x: 7, y: 20000),
  ),
  mapping: aes(x: "x", y: "y"),
  layers: (geom-point(size: 3pt),),
  scales: scales(y: scale-log10(breaks: breaks-log())),
  width: 10cm,
  height: 6cm,
)