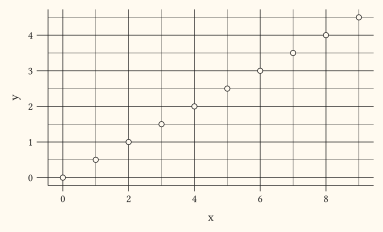
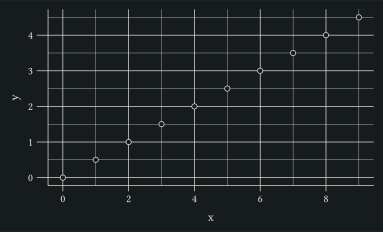
element-tick
Tick element: a line element that also carries the tick mark length.
Since 0.6.0.
Pass the result to theme under axis-ticks and its per-axis, per-side, and minor variants (axis-ticks-x, axis-ticks-y-right, axis-ticks-minor, …). element-line is accepted on the same keys and leaves length to the cascade. element-blank turns the marks off entirely: no ink and no reserved depth around the panel.
Usage
element-tick(
  colour: none,
  stroke: none,
  length: none,
)
Parameters
| Parameter | Default | Description |
|---|---|---|
colour |
none |
Tick colour, or none to inherit. |
stroke |
none |
Tick thickness. Either an absolute Typst length (e.g., 1pt), a ratio (e.g., 80%) scaling the parent surface stroke, or none to inherit the parent thickness unchanged. The native 1pt + red form is also accepted: its paint fills in colour unless colour is set. |
length |
none |
Tick mark length, measured outward from the panel edge. Either an absolute Typst length (e.g., 0.2cm), a ratio (e.g., 50%) scaling the parent surface length, or none to inherit the parent length unchanged. 0cm hides the marks while keeping their cascade in place. |
Returns
Element dictionary consumed by theme.
Examples
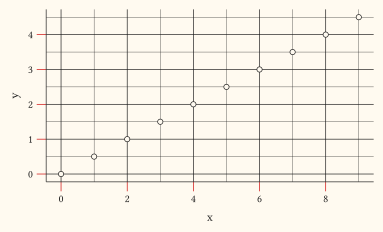
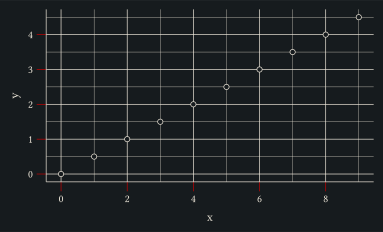
Longer ticks in red on both axes.
#let d = range(0, 10).map(i => (x: i, y: i * 0.5))
#plot(
  data: d,
  mapping: aes(x: "x", y: "y"),
  layers: (geom-point(size: 2pt),),
  theme: theme(axis-ticks: element-tick(
    colour: rgb("#cc0000"),
    length: 0.25cm,
  )),
  width: 10cm,
  height: 6cm,
)
Lengthen only the y axis; the ratio scales the length inherited from axis-ticks.
#let d = range(0, 10).map(i => (x: i, y: i * 0.5))
#plot(
  data: d,
  mapping: aes(x: "x", y: "y"),
  layers: (geom-point(size: 2pt),),
  theme: theme(
    axis-ticks: element-tick(length: 0.15cm),
    axis-ticks-y: element-tick(length: 200%),
  ),
  width: 10cm,
  height: 6cm,
)