breaks-quantile
Breaks at sample quantiles of the data.
Since 0.6.0.
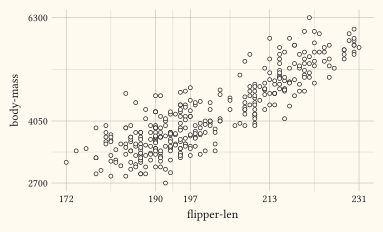
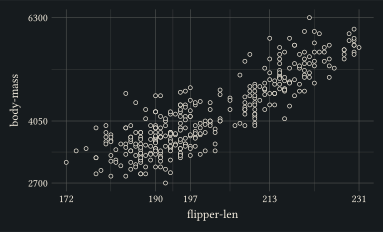
Places a tick at each requested probability, so the axis reports where the mass of the data sits rather than a regular grid. Quantiles interpolate linearly between the two neighbouring order statistics. The counterpart of scales::breaks_quantile().
Usage
breaks-quantile(
  probs: (0, 0.25, 0.5, 0.75, 1),
)
Parameters
| Parameter | Default | Description |
|---|---|---|
probs |
(0, 0.25, 0.5, 0.75, 1) |
Array of probabilities in [0, 1]. |
Returns
Closure taking the trained values and returning break positions.
Examples
Quartile ticks on both axes.
#plot(
  data: penguins,
  mapping: aes(x: "flipper-len", y: "body-mass"),
  layers: (geom-point(),),
  scales: scales(
    x: scale-continuous(breaks: breaks-quantile()),
    y: scale-continuous(breaks: breaks-quantile(probs: (0, 0.5, 1))),
  ),
  width: 10cm,
  height: 6cm,
)