format-log
Format a numeric break as a power of a base, in Typst math.
Returns a typst()-tagged string, so a break that is an exact power reads as 10^3 with a real superscript. A break that is not an exact power keeps a mantissa, which is what an automatic log axis needs: its breaks fall on 1, 2, and 5 times a power. The counterpart of scales::label_log(), except that scales writes a fractional exponent where this keeps the mantissa.
A secondary axis formats the value it has already transformed, so a dup-axis or sec-axis needs its own labels: to match the primary.
Usage
format-log(
  base: 10,
  digits: 3,
)
Parameters
| Parameter | Default | Description |
|---|---|---|
base |
10 |
Base of the powers; must be above 1. |
digits |
3 |
Significant decimal digits in the mantissa. |
Returns
A closure value => content.
Examples
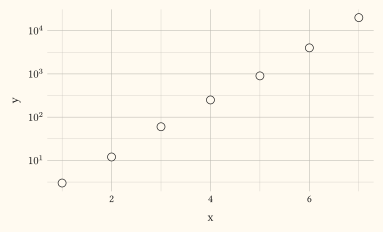
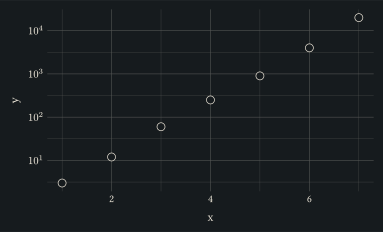
Decade labels on a log axis, written as powers of ten.
#plot(
  data: (
    (x: 1, y: 3), (x: 2, y: 12), (x: 3, y: 60), (x: 4, y: 250),
    (x: 5, y: 900), (x: 6, y: 4000), (x: 7, y: 20000),
  ),
  mapping: aes(x: "x", y: "y"),
  layers: (geom-point(size: 3pt),),
  scales: scales(y: scale-log10(labels: format-log())),
  width: 10cm,
  height: 6cm,
)